
Last week I shared the results from Part 1 of our survey in which 300+ SaaS companies shared data on their growth and go-to-market strategies. This week we dive into the results from Part 2 of the survey where we compare application delivery methods, operational costs and gross margins, contract terms, churn rates, capital requirements and accounting methods. This being our 3rd annual SaaS survey, we’re able to share this year’s results and look at how key metrics have changed. I look forward to hearing your comments below.
Thanks again to my partners in this effort David Spitz and his team at Pacific Crest Securities (@dspitz and @PacCrestSec, respectively on Twitter), and to OpenView who helped bring additional survey respondents.
If you’d like to receive or participate in next year’s survey, sign up here:
![]()
Operational Aspects
How is Your SaaS Application Delivered?

For the first time, we asked participants to provide information on their primary application delivery method (in-house or third-party) and how they expect that to change over the next three years. While more than half of the respondents indicated that they primarily rely upon self-managed servers today, future expectations revealed a marked trend toward third-party delivery solutions, with AWS being the primary beneficiary.
SaaS Application Delivery Method(1) as a Function of Size of Company
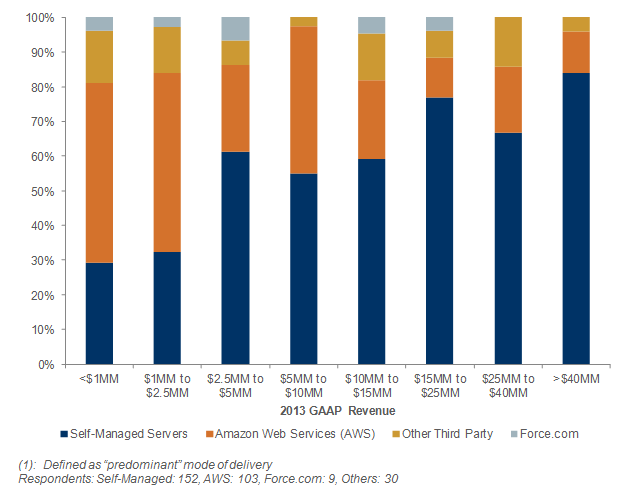
When filtered by company size, smaller respondents reported more frequent use of third-party providers as their primary application delivery method, while the largest companies were more likely to use self-managed servers.
Comparison of Growth Rates for Companies Managing Their Own Servers vs. Using 3rd Parties
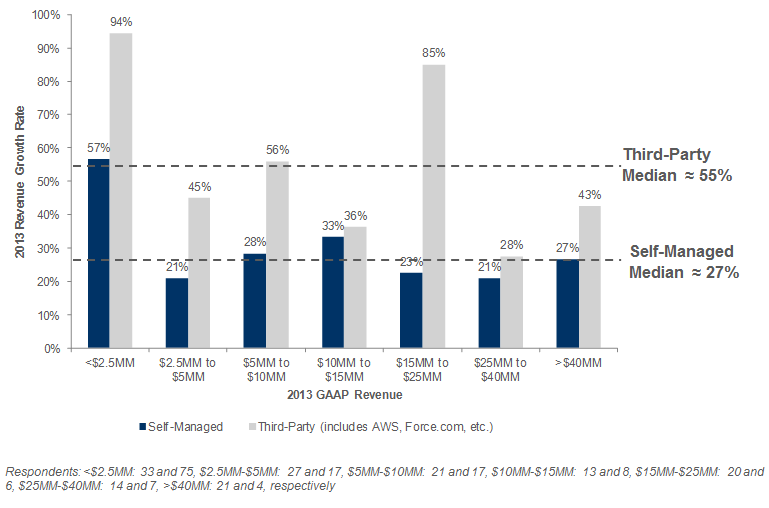
Interestingly, companies that delivered their applications through third -party managed servers generally experienced faster growth rates (in some cases considerably faster) – and this trend was true across companies of all sizes.
What Are Your Operational Costs to Deliver the SaaS Application?
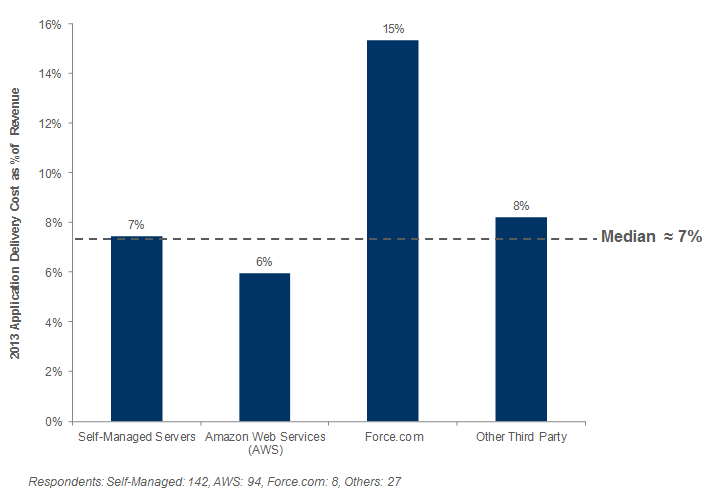
Respondents relying primarily on self-managed servers reported a median delivery cost of 7% of sales, while those primarily using AWS reported a slightly lower median of 6%. The median cost of delivery for respondents on Force.com was considerably higher at 15%.
Operational Costs as a Function of SaaS Application Delivery, Grouped by Size Tiers
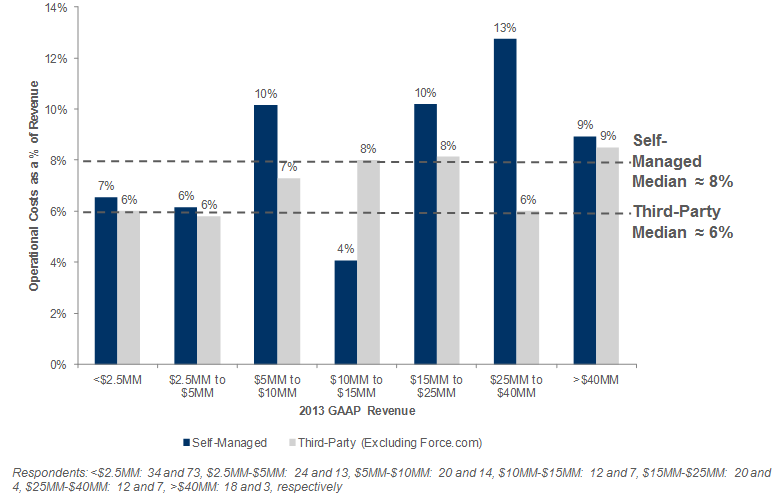
Aside from the $10MM-$15MM group, companies generally faced increased operational costs when they managed their own servers. It’s also surprising that we don’t see more economies of scale in each data set.
Subscription Gross Margin as a Function of SaaS Application Delivery Method
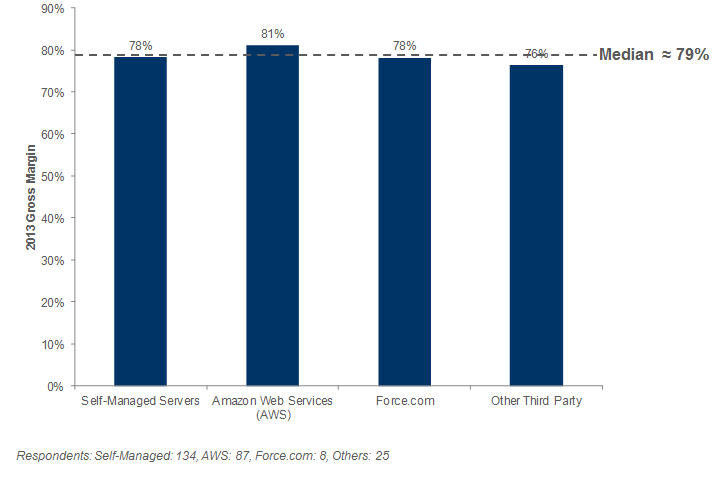
Interestingly, despite the aforementioned differences in estimated operational costs, median subscription gross margins did not meaningfully vary when filtered by SaaS application delivery method.
Cost Structure
Cost Structure and Future Expected Operating Leverage (Excluding Companies <$2.5MM in Revenue)
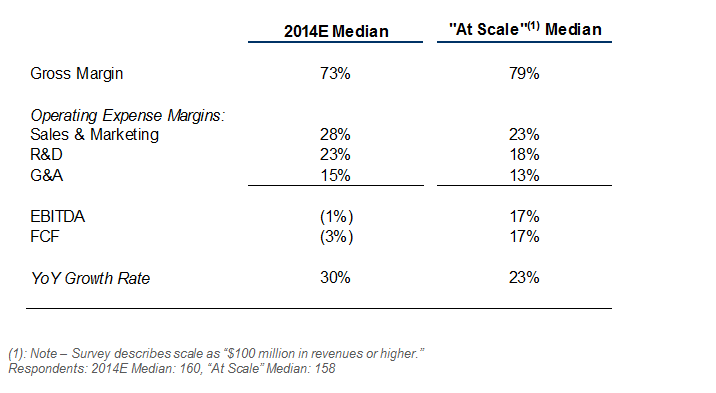
The median numbers reflect respondents’ beliefs that the most operating leverage will come from improvements in gross margin, S&M and R&D (note that results from companies <$2.5MM in revenues have been excluded). Results were very similar to last year’s survey. Note that in the survey question we adjusted our definition of “at scale” upward from $50M+ in revenue referenced in the 2013 survey, to $100M+ in revenue in the 2014 survey. The only significant change in response was lower anticipated “at scale” growth rate of 23% vs. 28% last year.
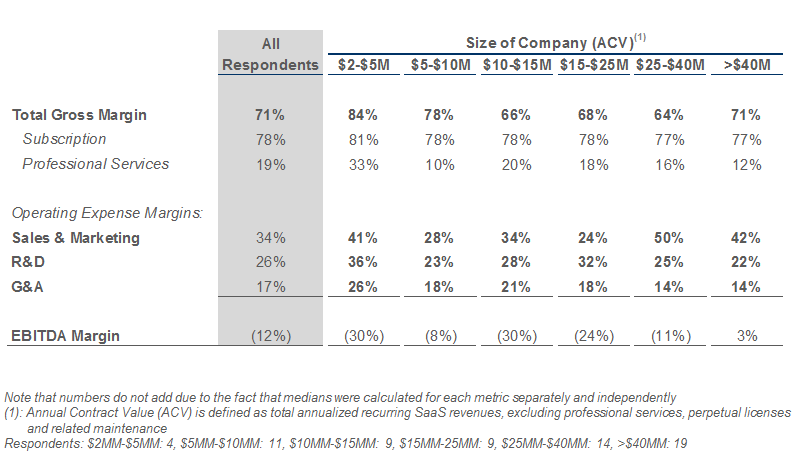
Median Cost Structure by Size (Includes Only Companies Audited by Top 5 Accountant with >$2MM in ACV)
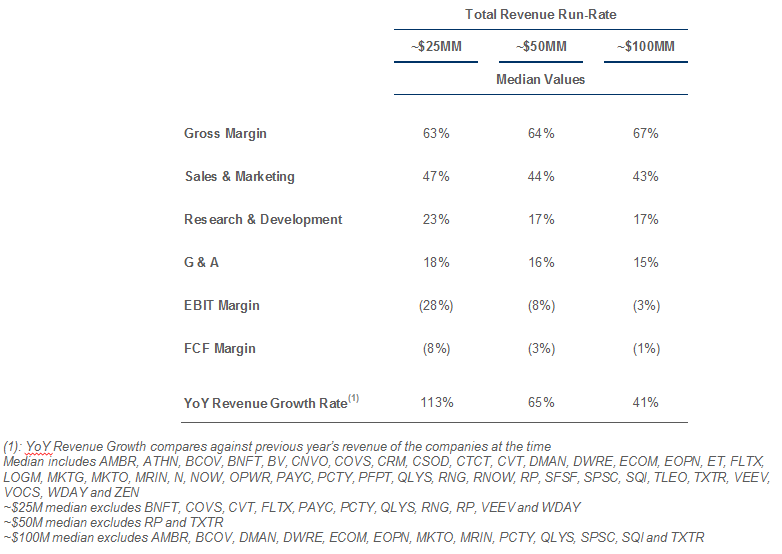
For Comparison: Historical Results of Selected Public SaaS Companies
Sales & Marketing Spend vs. Projected Growth Rate (Excluding Companies <$2.5MM in Revenue)
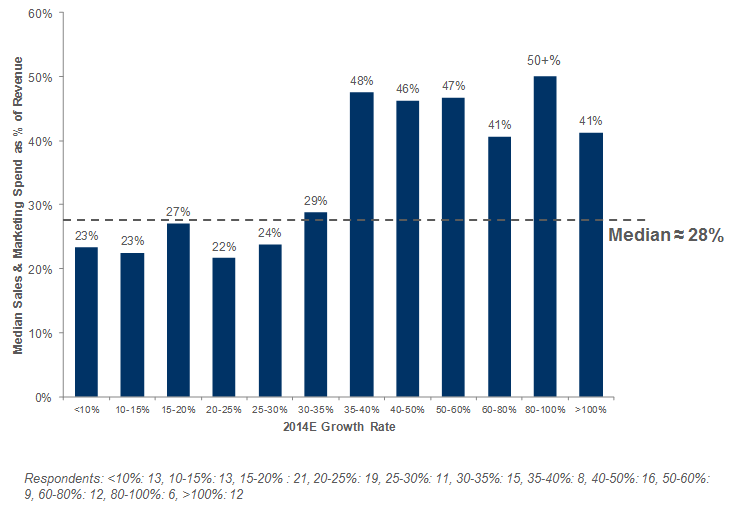
Not surprisingly, companies which spend more on sales & marketing (as a % of revenue) expect to grow at a faster rate than those which spend less. It is interesting to see a step function at 35% growth, and not much increase in sales & marketing spend % thereafter. Our 2013 results showed no correlation. However, in the 2012 and 2011 surveys, we saw a similar correlation of higher S&M spend leading to higher expected growth rates.
Contracting & Pricing
Median Annual Contract Size (ACV) per Customer
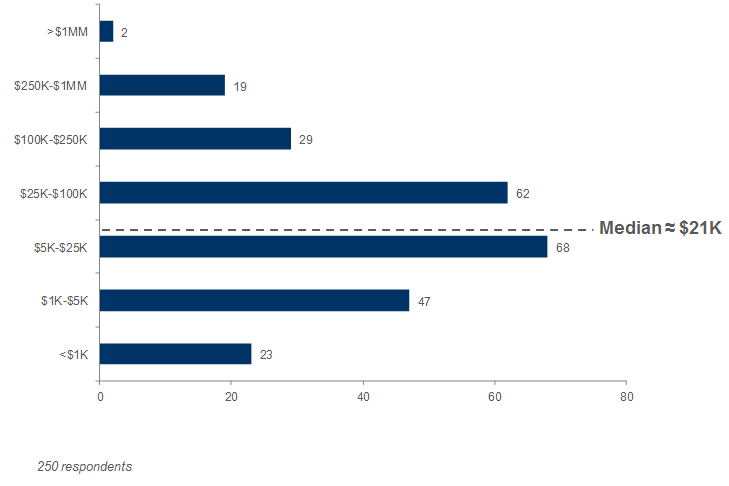
The median annual contract size (subscription component only) for the group was $21K per year. These results are in-line with previous survey medians of $20K and $24K in 2013 and 2012, respectively.
Median / Typical Contract Terms for the Group
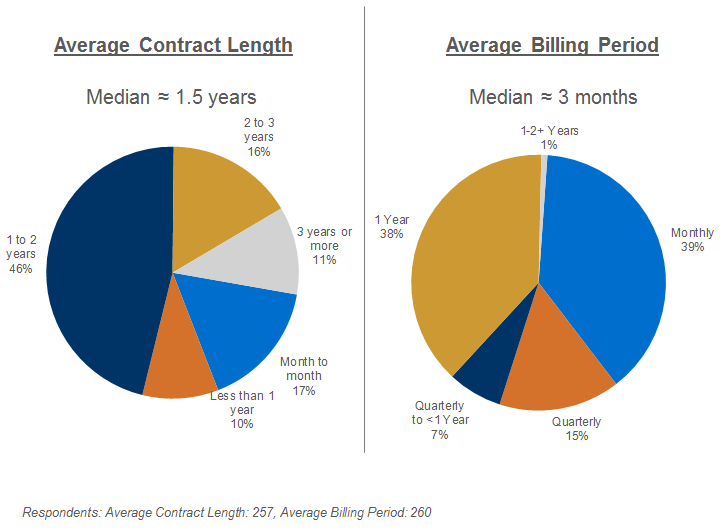
The median average contract length is 1.5 years; and the median billing terms are quarterly (three months in advance). These results were essentially the same median contract length and median billing period as in the 2013 survey.
Contract Length as a Function of Contract Size

The phenomenon of longer contract terms for larger contracts is pretty clear. As compared to previous surveys, for companies in the “elephant hunter” group, we see a continued shift each year we conduct the survey towards shorter contract lengths. Comparatively, respondents with >$250K ACV appear to be shying away from contracts longer than 3 years, which comprise only 5% of total contracts (compared to 45% in 2013 and even higher in 2012).
What is Your Primary Pricing Metric?
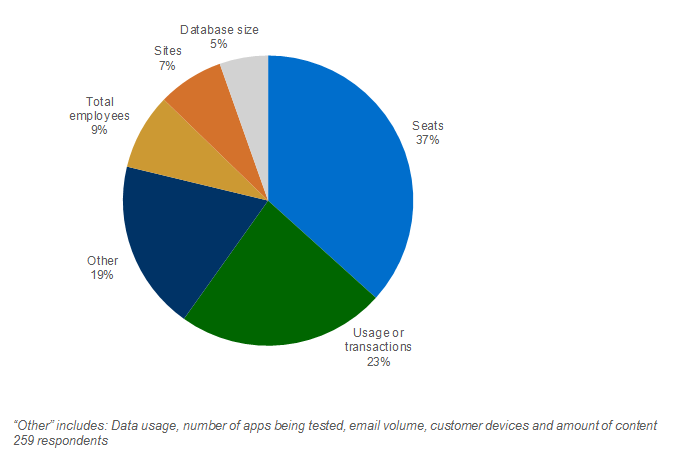
These results are largely in-line with 2013 and 2012 results.
Annual Gross Dollar Churn (Excluding Companies <$2.5MM in Revenue)
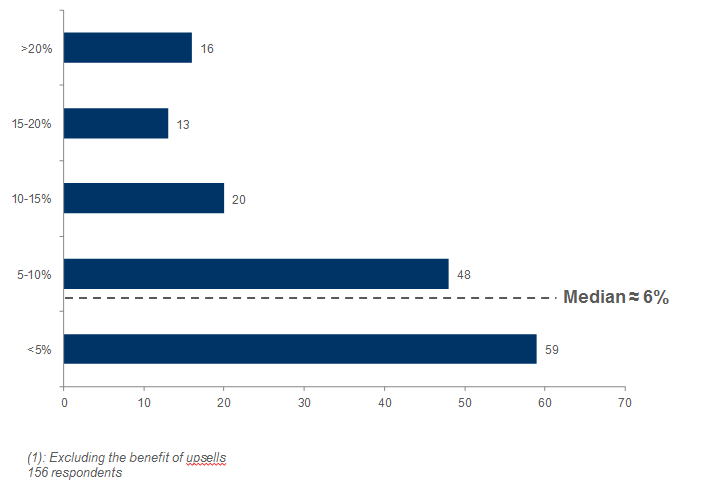
Annual gross dollar churn (without the benefit of upsells) is 6%. The results were virtually the same when including companies <$2.5MM in revenues. This result is lower than the 2013 result of 8%, but higher than the 5% we found in 2012.
Annual Unit Churn(1) (Excluding Companies <$2.5MM in Revenue)
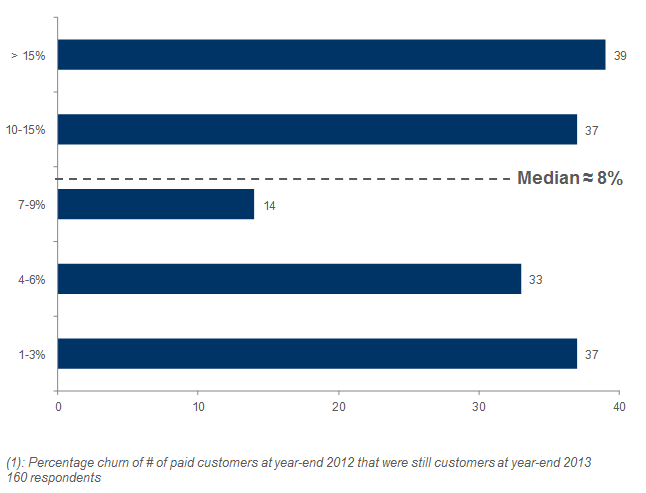
Reported median annual unit churn (by customer count) is 8%. This follows conventional wisdom that unit churn is generally higher than gross dollar churn, as smaller customers tend to churn more often. In comparison with previous results, essentially the same result was found in 2013. This number surprises me, as in my many meetings with younger SaaS companies, I see a greater percentage of companies with higher annual unit churn rates (i.e. between 15 and 25%) than this chart would indicate.
Annual Gross Dollar Churn as a Function of Contract Length (Excluding Companies <$2.5MM in Revenue)
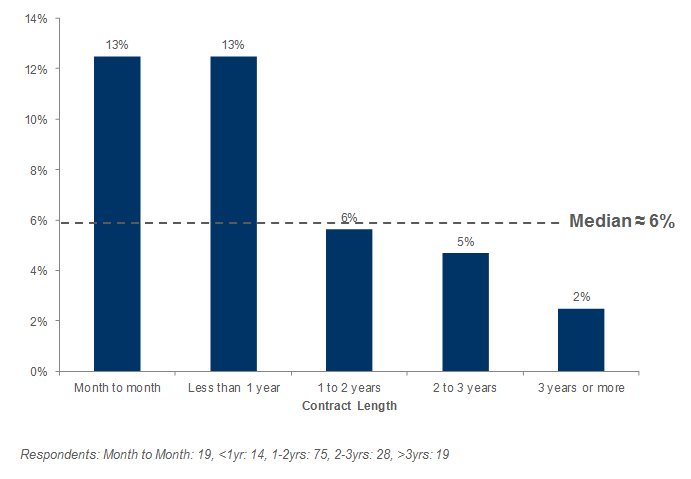
Not surprisingly, companies with very long-term contracts (2+ years) have the lowest annual dollar churn. As expected, companies with short-term contracts (<1 year) tend to experience higher churn. Compared with previous surveys, this year’s respondents with shorter average contract lengths reported notably higher churn than in previous years. We believe that this year’s increased sample size improves the accuracy of our results.
Annual Gross Dollar Churn as a Function of Contract Size (Excluding Companies <$2.5MM in Revenue)
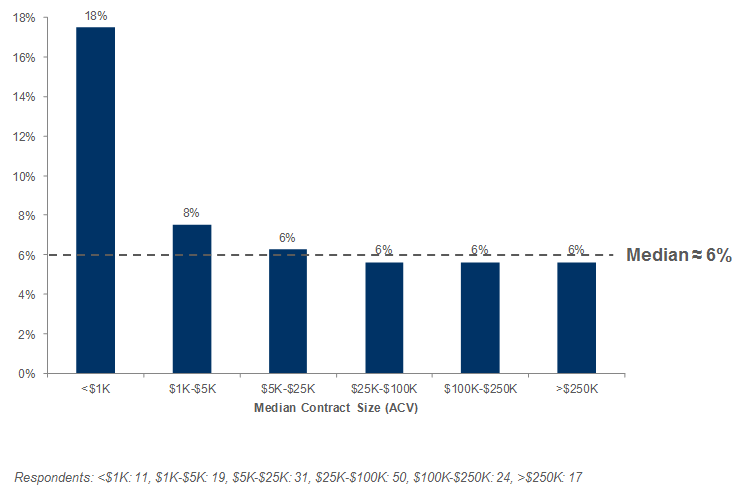
Interestingly, once median ACV is over $1K, churn rates for the group do not vary substantially by contract size. Below $1K median ACV, churn goes up significantly. 2013 results showed no patterns in the broad middle ranges ($1K-$250K) while 2012 and 2011 results showed a more representative churn curve (with larger contract sizes correlating to lower gross dollar churn).
Annual Gross Dollar Churn as a Function of Primary Distribution Mode (Excluding Companies <$2.5MM in Revenue)
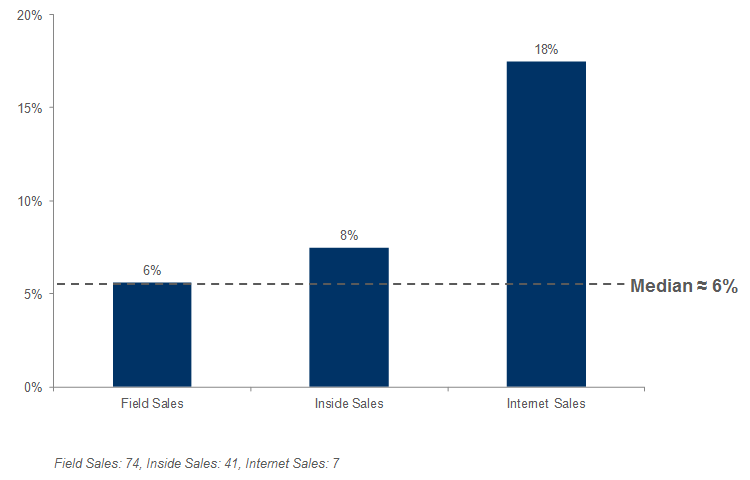
Those companies employing primarily field sales had slightly lower churn rates than those employing primarily inside sales. Online distribution had substantially higher churn (though, this comes from a low sample size.) These results were consistent with 2013 and 2012 survey results.
Annual Net Dollar Retention from Existing Customers
“How much do you expect your ACV from existing customers to change, including the effect of both churn and upsells?”(1)
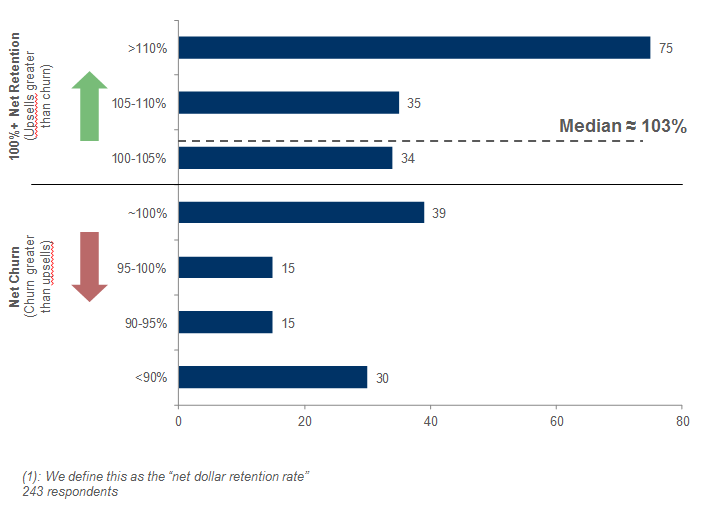
The median annual net dollar retention rates (DRR), including churn, but also including the benefit of upsells, is 103%. The result does not change when removing the smallest companies (<$2.5MM in revenue) from the group. Comparatively, results were slightly higher than 2013 (101%) and 3 percentage points lower than 2012 (106%). It’s interesting to note that the largest group of respondents are the most optimistic, expecting a >110% net retention. (Regular readers of my blog will know that I frequently discuss the importance of getting to “Negative Churn”. A net dollar retention rate (DRR) of >100% is another way of saying that a SaaS company has achieved negative churn.)
Comparison of Unit Economic Leaders to All Other Companies (Excluding Companies <$5MM in Revenue)
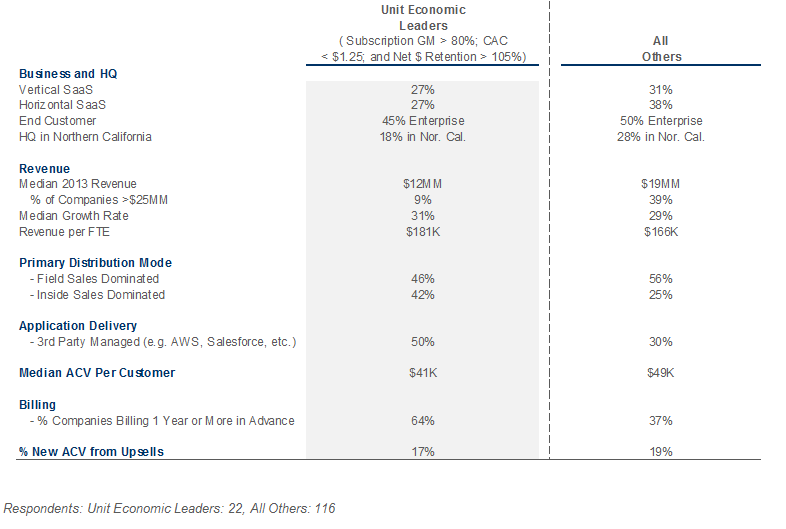
Superior unit economics – high lifetime value of customer (LTV) and low CAC – are critical success factors. We compared the 22 companies with the strongest metrics used to derive LTV and CAC with everyone else, and found some interesting patterns. These strongest companies are less likely to serve enterprise customers, be headquartered in Norther California, and be >$25MM. They are more likely to to be inside sales dominated and bill for 1 year terms or more.
Capital Requirements
Capital Raised So Far
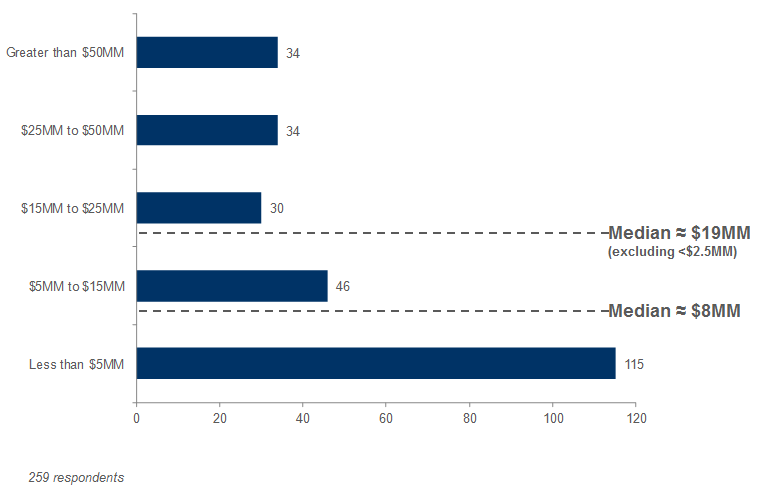
Companies in the survey group have raised a median of roughly $8MM in capital so far. If we exclude companies <$2.5MM, the median jumps up to $19MM. Results from this year are in-line with 2013 results, but well below the $23MM in capital raised by participants in the 2012 and survey.
Analysis of Companies by Capital Raised
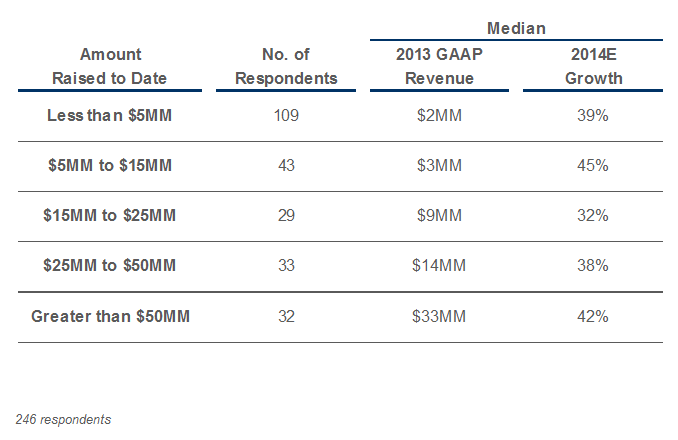
Compared with previous surveys, the 2014 respondents had generally raised comparable amounts of capital to achieve similar levels of revenue as in our 2013 survey. The notable exception is last year’s respondents which reported $15MM-$25MM capital raised had a higher median trailing year revenue of $20MM.
Capital Efficiency Expectations – Median Levels for the Group
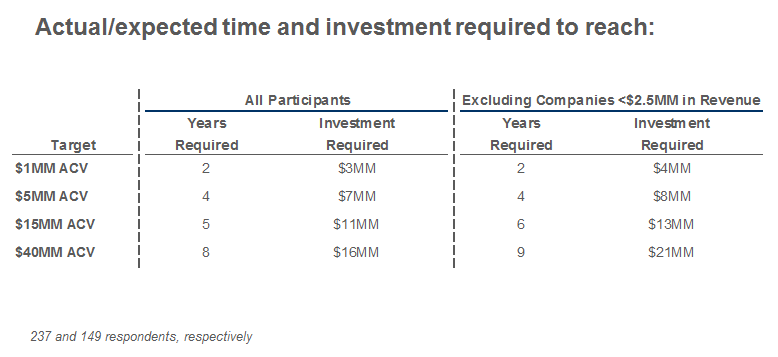
This year’s results were very similar to 2013 survey results. (The 8 and 9 years median time to reach $40mm ACV are not representative of successful SaaS companies that have gone public. Those companies have ramped considerably faster, but also consumed a lot more capital.)
Accounting Policies
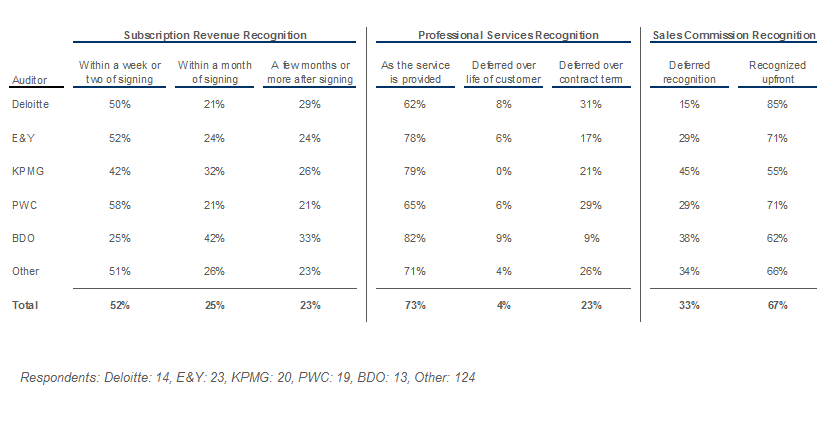
Subscription Revenue Recognition Policies
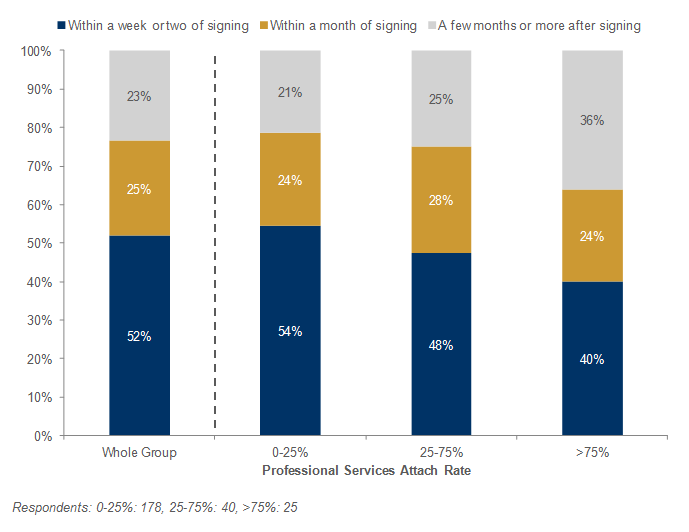
While approximately 52% of the respondents indicated that they begin recognition very soon (within a week or two) after signing new contracts, we found an expected correlation between more delayed revenue recognition and a higher professional services attach rate. However, it’s interesting to see that a meaningful number of companies with significant services were still able to start subscription revenue recognition quickly.
Professional Services Revenue Recognition Policies
“What is the predominant mode for recognizing professional services revenues?”
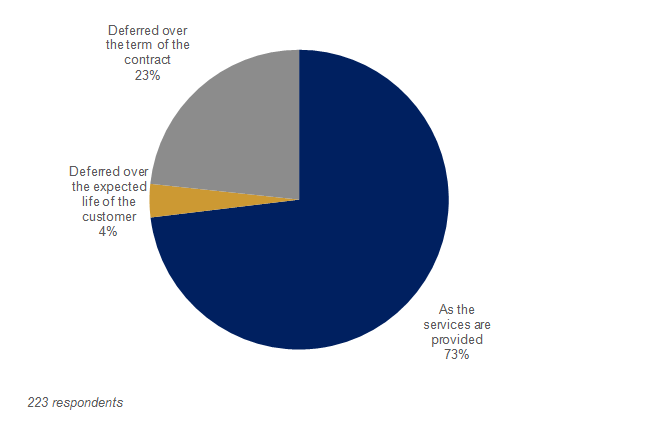
The clear majority of respondents offering professional services indicated that they recognize revenue as the services are provided.
Sales Commission Costs Recognition Policies
“How do you recognize sales commission costs (deferred or recognized upfront)?”
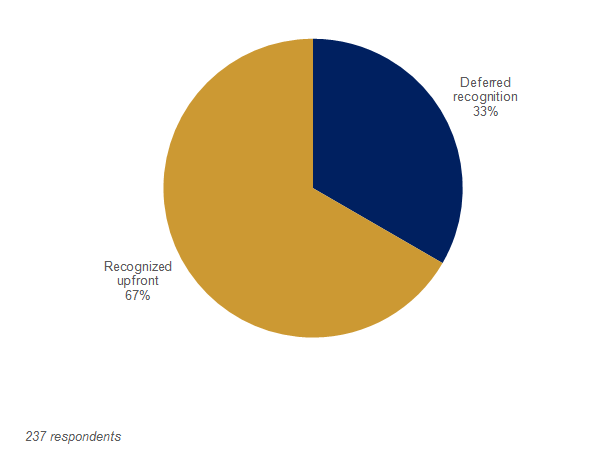
We also inquired as to the recognition of sales commission costs. We found two-thirds of respondents indicating they recognize commission costs up-front. This is an interesting accounting choice: if you choose not to defer recognition of sales commissions, your great bookings quarters where you exceed plan will also be accompanied by higher expenses than plan, making the company look like it doesn’t know how to control expenses. Deferring recognition will spread those expenses so that they occur in line with the revenue from the new bookings, avoiding that surprise. The negative with this approach is that it requires a complex tracking system.
What Accounting Firm Do You Use?
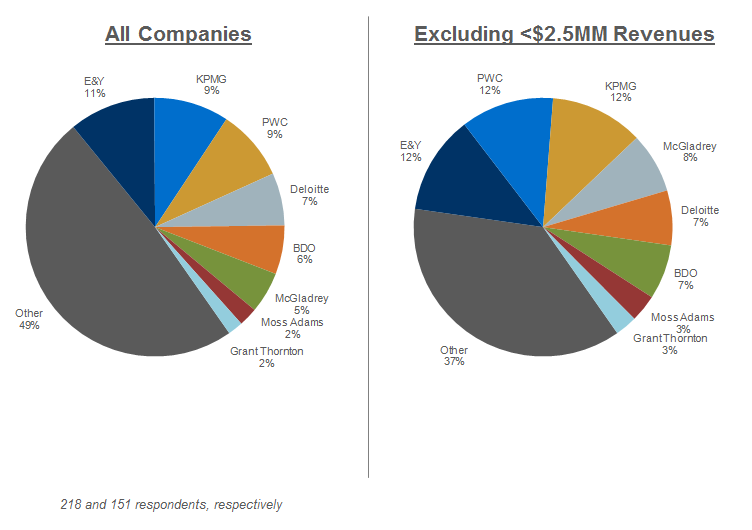
To see if we could establish any patterns, we asked respondents to state their respective accounting firms. The Big 4 represented 36% of all respondents (43% when removing the small companies from the group).
Accounting Policies Across Selected Accounting Firms
We’d love to hear your comments below about this year’s survey findings and what data you’d find useful to see next year. To get results about growth trends and go-to-markets, please read Part 1 of the SaaS Survey. If you’d like to receive or participate in next year’s survey, sign up here:
![]()


