
For the sixth year in a row, we’re proud to work with KBCM Technology Group (formerly Pacific Crest Securities) to share results from a survey of over 400 private SaaS companies. The survey represents deep benchmarking data and insights on growth and operations of private SaaS companies.
Thank you to the readers of forEntrepreneurs who participated in taking the survey! Thank you also to David Spitz (@dspitz) and the team at KBCM Technology Group for their work on the survey.
To download the full 2017 report, click here.
Part 1 of the survey results focuses on:
- Growth rates
- Go-to-market trends
- Operational aspects
- Cost structure
For Part 2 results covering contracting & pricing, retention & churn, capital requirements and accounting policies, click here.
Also check out the forEntrepreneurs 2017 SaaS Infographic which highlights major takeaways from the survey, presented in a visual format.
We have made some important changes this year, including: (1) using annual recurring revenue (ARR) rather than GAAP revenue as a primary gauge of size and growth; and (2) asking respondents to provide precise numbers (vs. ranges) for certain key data.
If you’d like to participate in or receive results from the next SaaS survey, sign up now:
Intro
Survey Participants
- ~400 responses from senior executives at SaaS companies
- $8.5MM median 2016 ending ARR, with over 85 companies > $25MM
- Median organic growth in ARR in 2016 was 47% (37% for companies >$5MM in ARR)
- Median employees (FTEs): 78
- Median customer count: 356
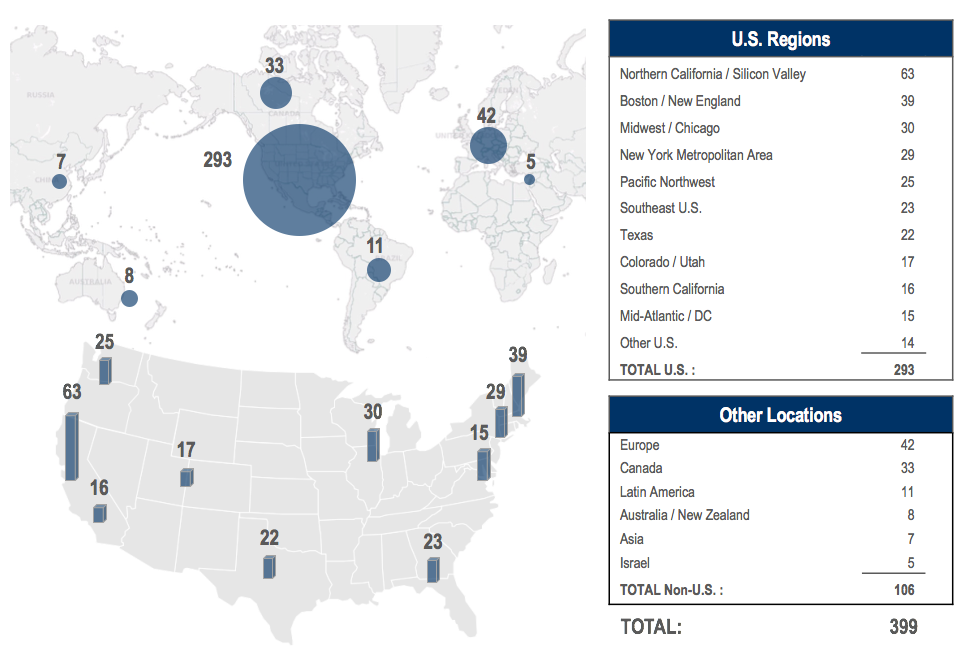
- 73% headquartered in the U.S.
- ~$21K median annual contract value (ACV), with 26% of respondents below $5K and 13% above $100K
- 41% use Field Sales and 27% use Inside Sales as their predominant mode of distribution
Survey Participant Geography (HQ)
Survey Participant Size Distribution

Employee Base

Growth Rates
How Fast Did You Grow Your ARR in 2016?
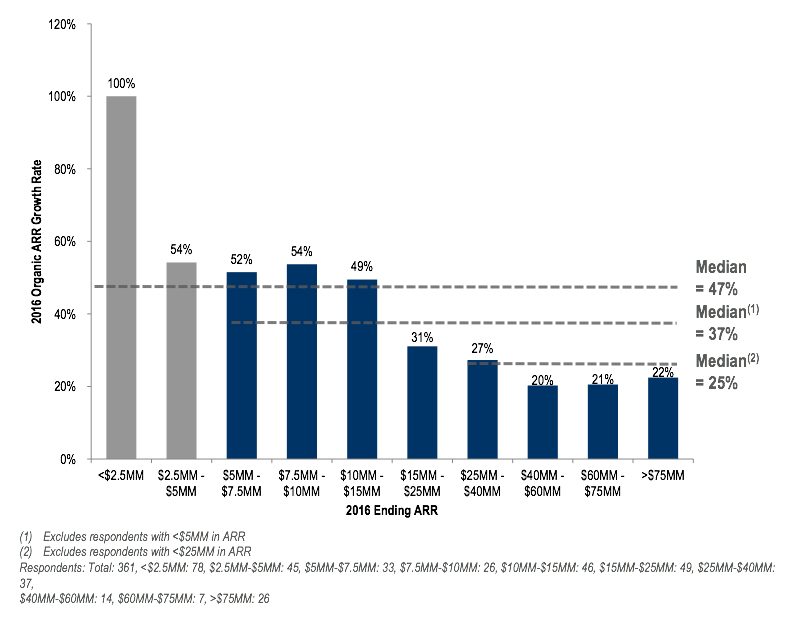
The median growth rate drops to 25% for companies with over $25M in ARR and just one-in-five companies with over $25M in ARR experienced growth rates over 50%.
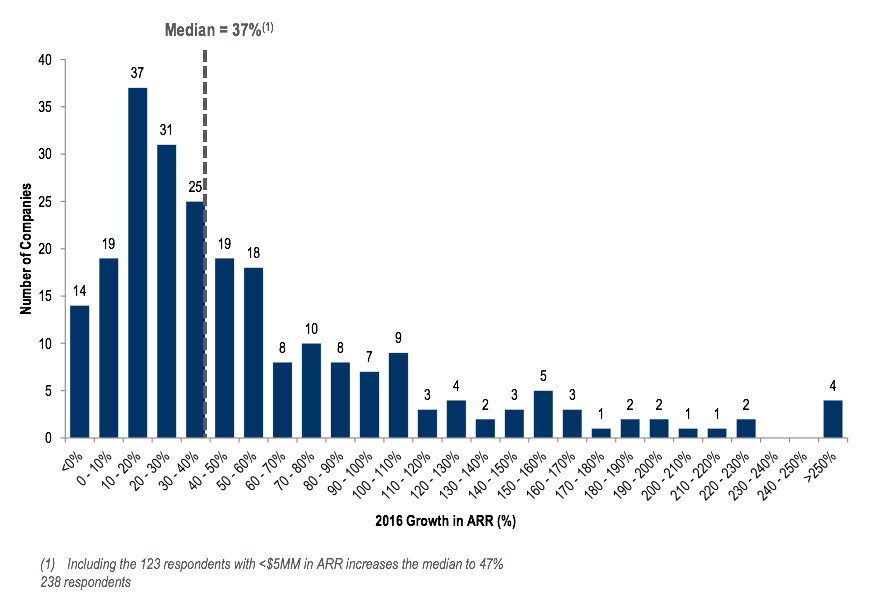
How Fast Did You Grow ARR Organically in 2016?
(Excluding companies <$5MM in 2016 ending ARR)
How Fast Did You Grow ARR Organically In 2016?
(Scatter view of companies >$10MM 2016 Ending ARR)
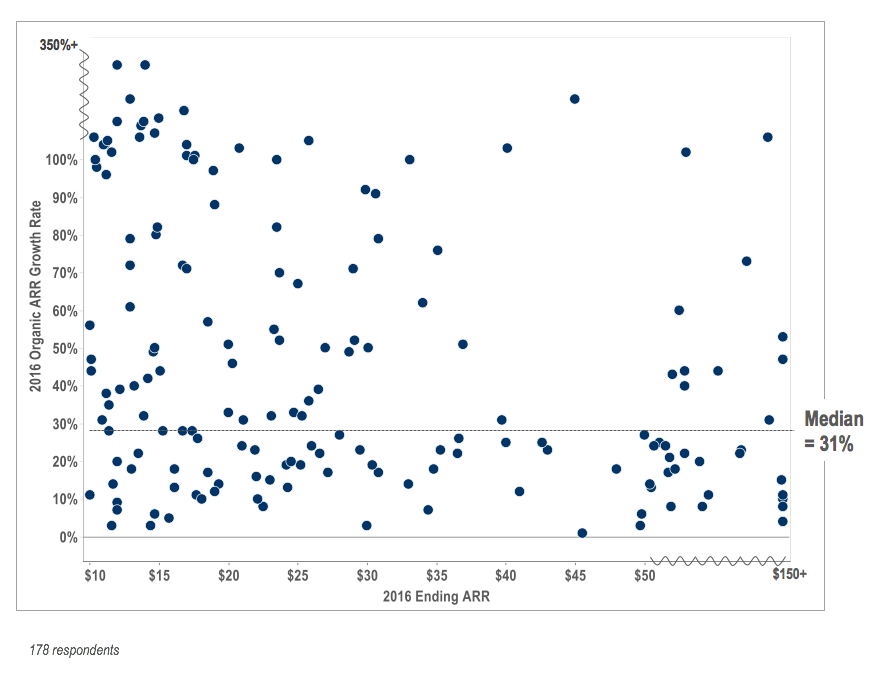
This year, for the first time, participants provided precise values for ARR, allowing us to present a true size-growth visualization. (Note that this chart only includes companies over $10MM in ARR and collapses the scales at the high ends for presentation purposes).
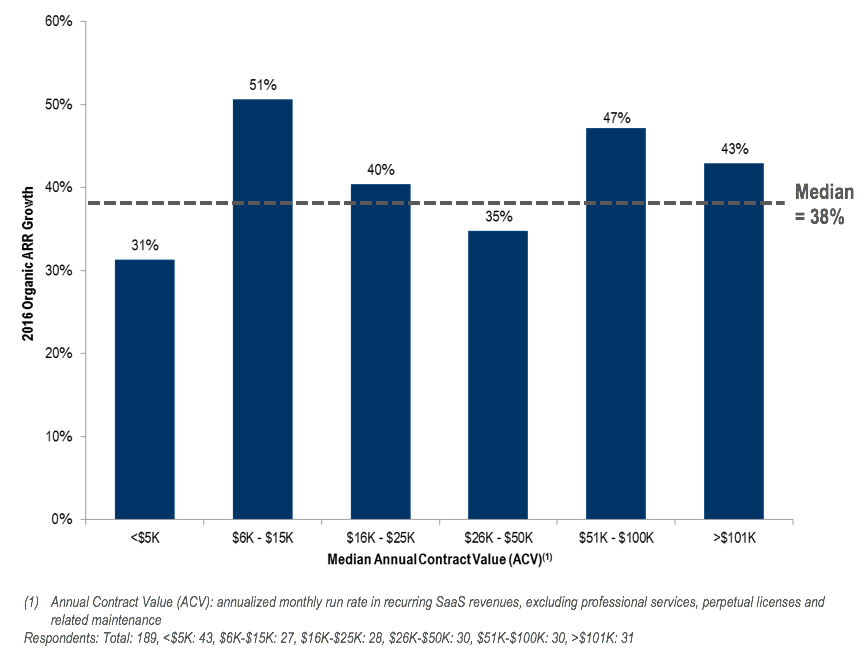
Median Growth Rate as a Function of Contract Size
(Excluding companies <$5MM in 2016 Ending ARR)
Median Growth Rate as a Function of Sales Strategy
(Excluding companies <$5MM in 2016 Ending ARR)

All else equal, the data shows no discernible advantage (as measured by successful growth) for Field-dominated vs. Inside-dominated distribution. Interestingly, though the data is somewhat sparse, Channel-dominant strategies show some real strength.
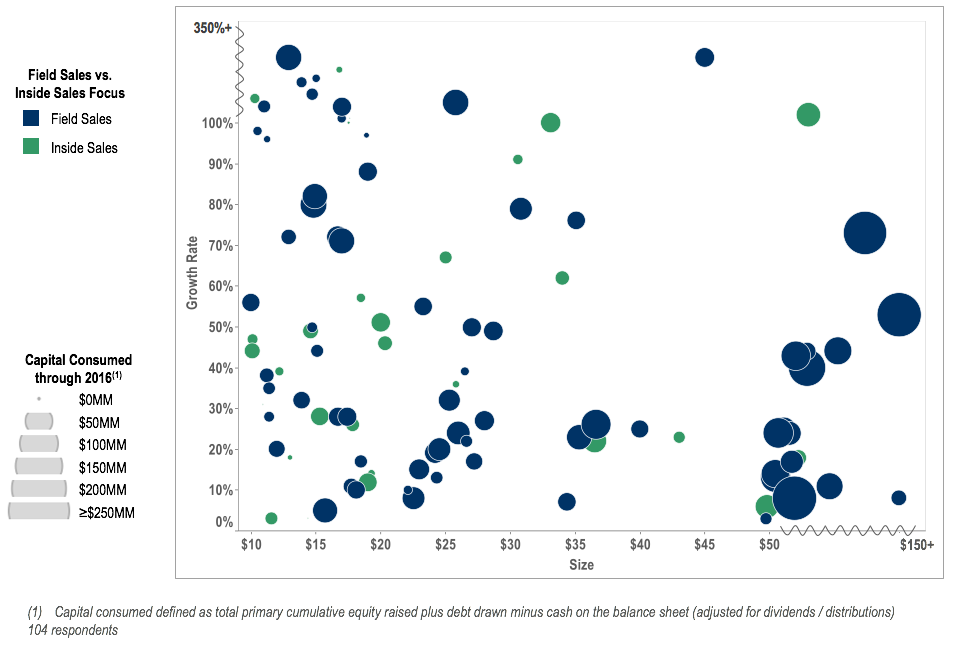
Distribution Strategy & Capital Efficiency
(Size-growth scatter view of companies >$10MM in 2016 Ending ARR)
Median Growth Rate as a Function of Target Customer
(Excluding companies <$5MM in 2016 Ending ARR)
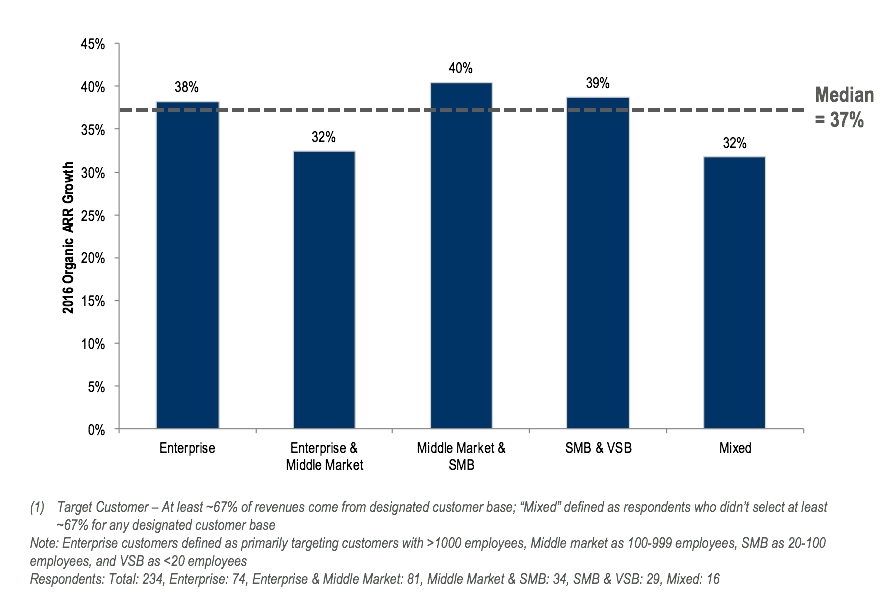
Companies focused either 1) mainly on the high-end or 2) mainly on the mid- and low-end (Mid-market, SMB & VSB) grew modestly faster than mixed or Enterprise / Mid-market companies. In comparison, last year’s results indicated there was minimal correlation across these groups.
Sales & Marketing Spend vs. Growth Rate
(Excluding companies <$5MM in 2016 Ending ARR)
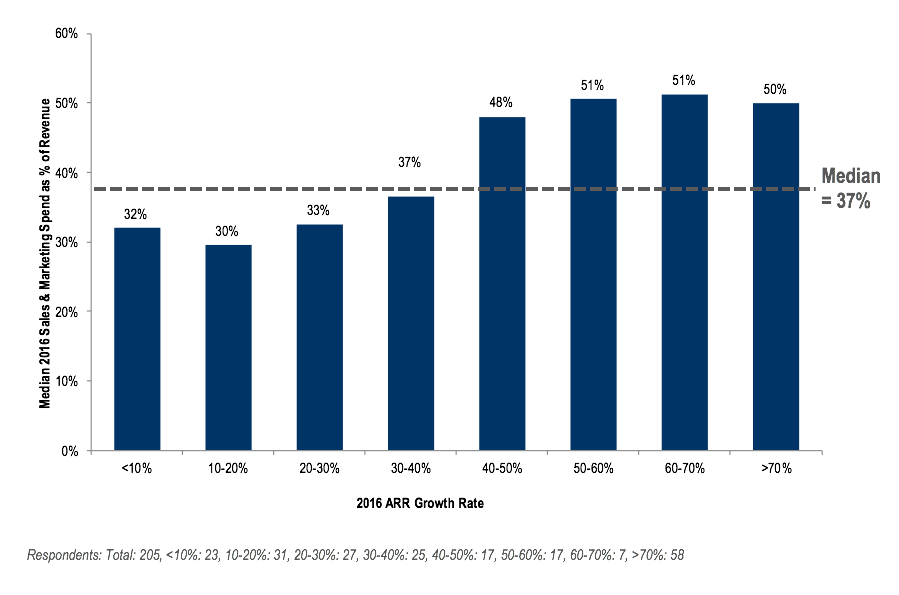
Not surprisingly, the fastest growing companies spent more on Sales & Marketing. These results are in line with previous years’ results.
Go-To-Market
Primary Mode of Distribution
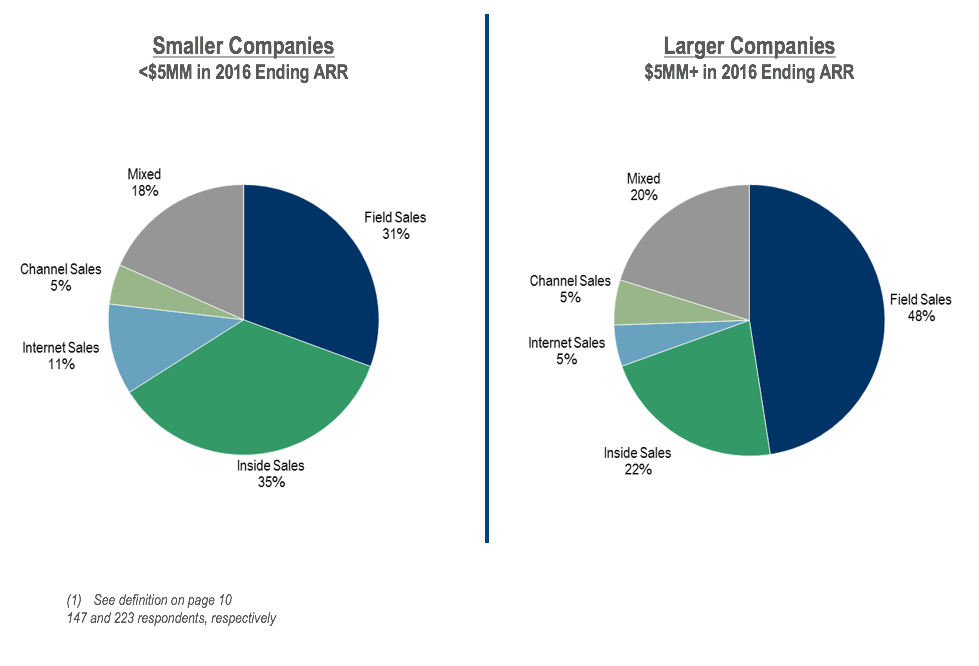
Primary Mode of Distribution as a Function of Median Initial Contract Size
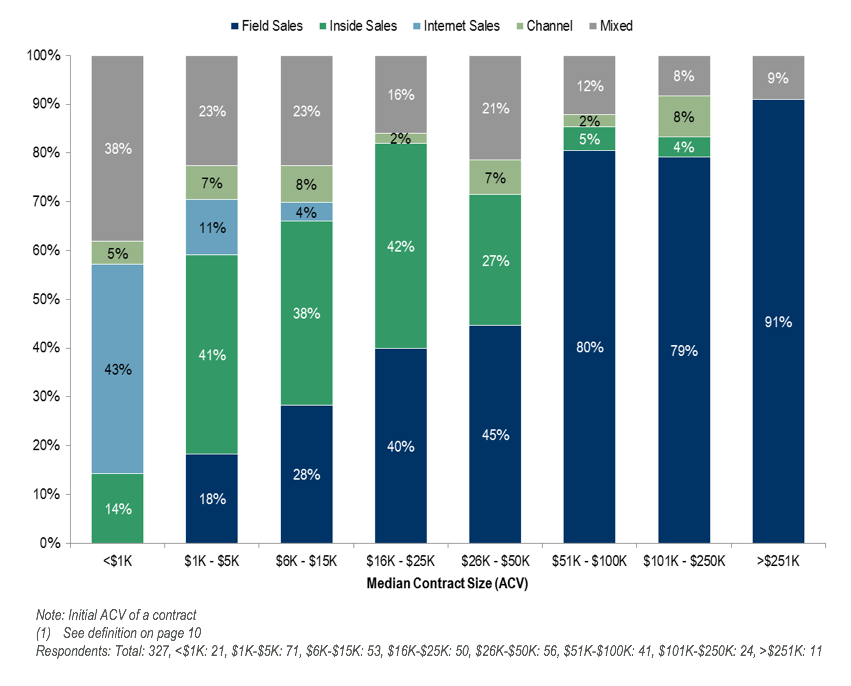
Analyzed by contract value, Field sales dominates for companies with median deals over $50K. Inside sales strategies are most popular among companies with $1K-$25K median deal sizes. In comparison with previous surveys, this year shows more confidence in Inside sales in the $1K-$25K range.
Distribution Strategy: Analysis of Field vs. Inside Sales in Key Crossover Deal Size Tiers
(Excluding companies <$5MM in 2016 Ending ARR)
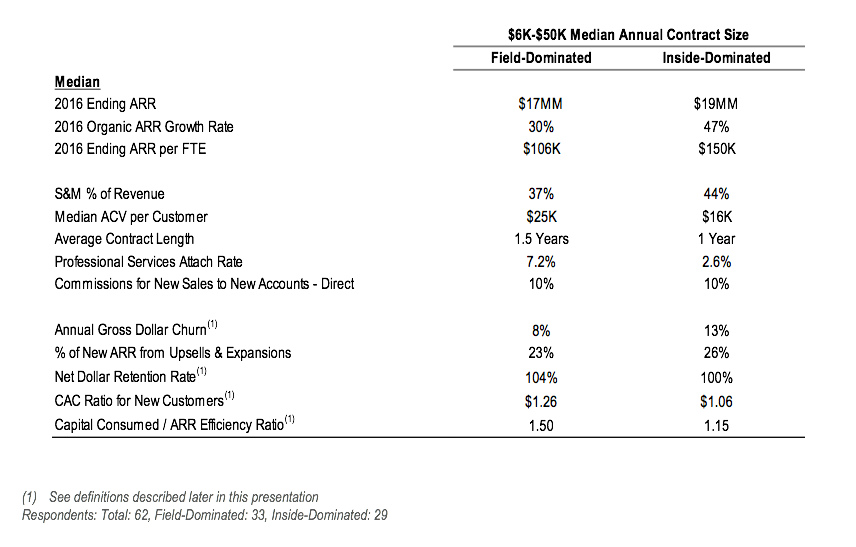
Among companies selling $6K-$50K average ACV, we compared those favoring Field vs. Inside sales and found: 1) Inside sales driven companies had higher growth and were more capital efficient; 2) Field sales driven companies had lower churn and higher net dollar retention rates.
CAC Ratio: How Much Do You Spend for $1 of New ARR From a New Customer?
(Excluding companies <$5MM in 2016 Ending ARR)
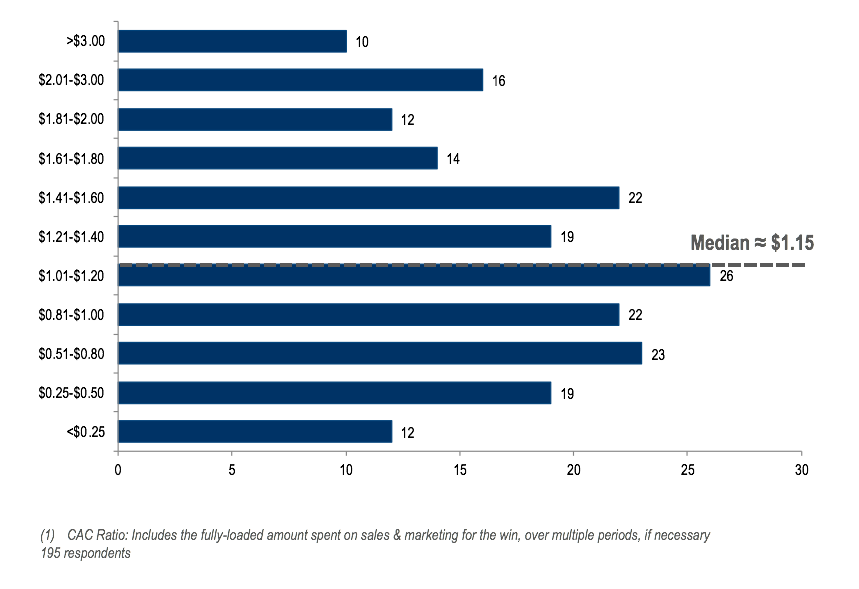
Respondents (excluding the smallest companies) spent a median of $1.15 to acquire each dollar of new ARR from a new customer. This is similar to last year’s result of $1.13.
CAC & Capital Efficiency
(Size-growth scatter view of companies >$10MM in 2016 Ending ARR)

CAC Ratio on New Customers vs. Upsells, Expansions, & Renewals
(Excluding companies <$5MM in 2016 Ending ARR)
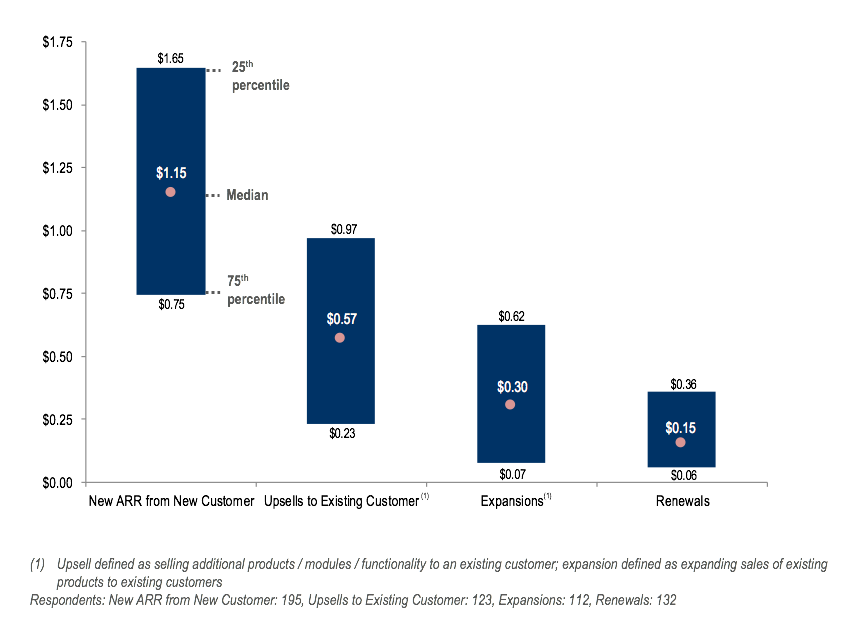
The median cost to acquire $1 of new upsell ARR ($0.57) is 50% of the cost to acquire $1 of ARR from a new customer. The cost to acquire $1 of new expansion ARR ($0.30) is 26%, and the cost for $1 of renewal ARR ($0.15) is 13%. Compared to previous survey results, this year’s group is spending substantially more on CAC for upsell dollars. Last year, upsell CAC was $0.27, or 24% of new customer CAC.
CAC Ratio on New Customers as a Function of Size of Company
(Excluding companies <$5MM in 2016 Ending ARR)
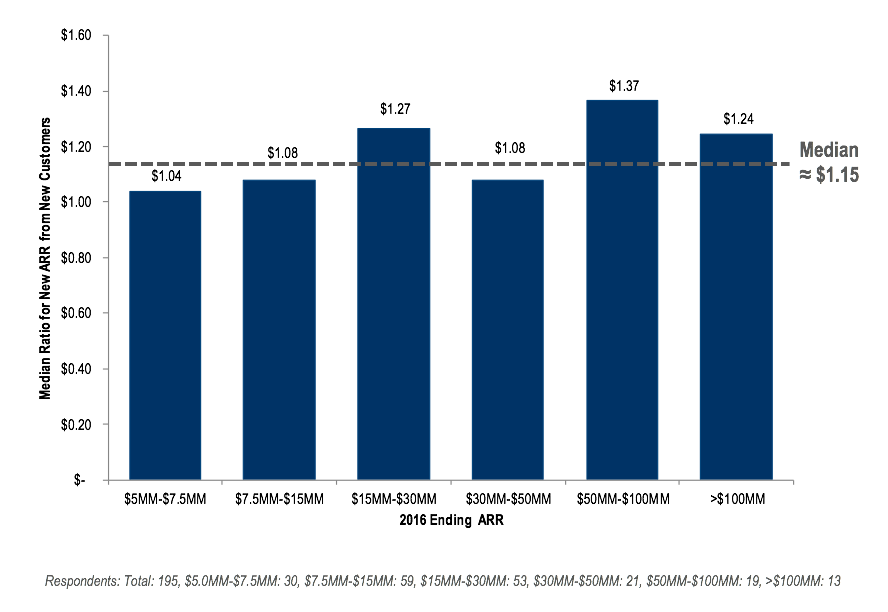
While it is difficult to assert that there is significant correlation between size of company and CAC ratio, there appears to be a modestly higher tolerance among larger companies to spend more on CAC.
CAC Ratio by Primary Mode of Distribution
(Excluding companies <$5MM in 2016 Ending ARR)
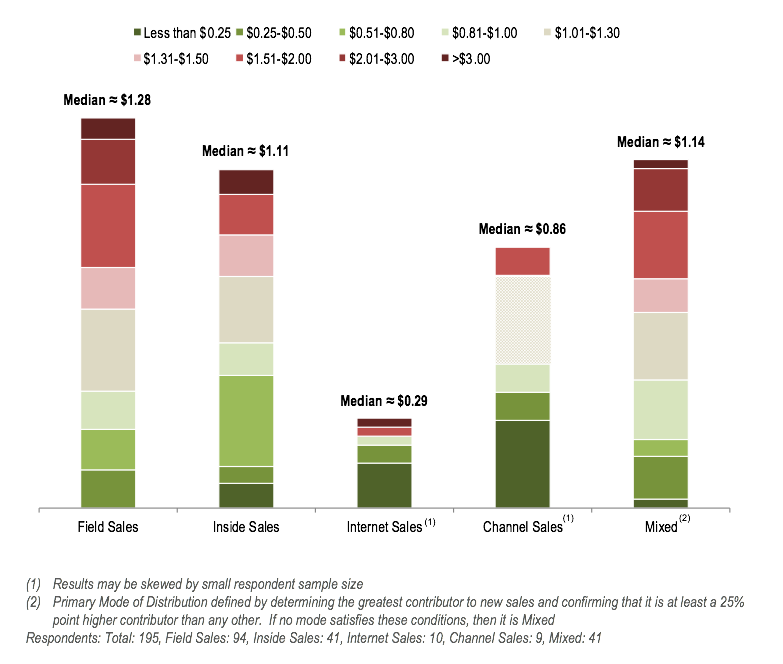
Other than Internet and Channel sales, where CAC appears significantly lower (but data is sparse), there is no significant correlation between go-to-market approach and median CAC, nor is there a meaningful difference between the distribution of responses.
CAC Ratio Spend as a Function of Target Customer
(Excluding companies <$5MM in 2016 Ending ARR)
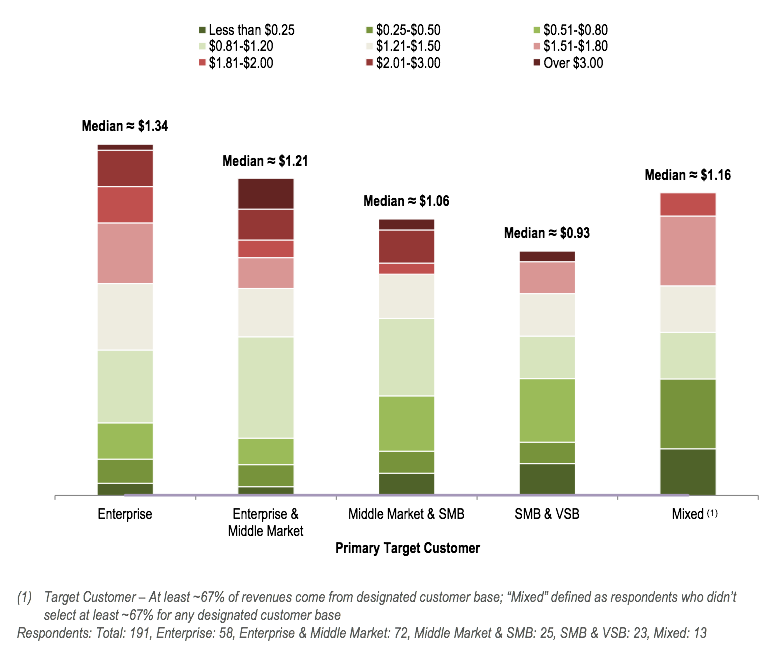
Not surprisingly, the median CAC ratio for companies targeting larger enterprises is higher than that for those targeting VSB, SMB, and Middle Market companies.
S&M Composition: Sales vs. Marketing Cost %
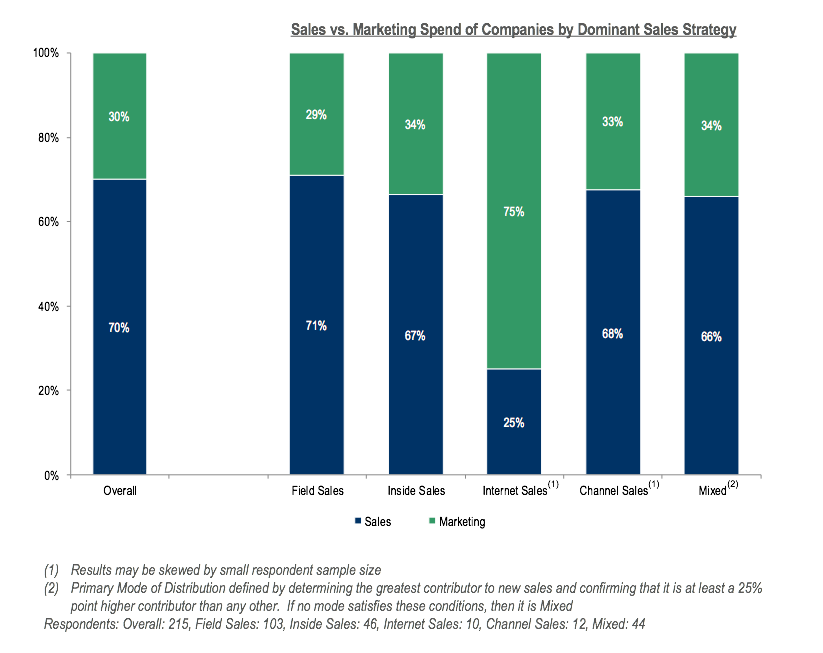
Overall, the median company devotes 30% of their S&M expenses to Marketing, with the remainder allocated to Sales. However, Internet sales-driven companies have much greater reliance on Marketing at 75%. This year’s results are largely consistent with previous years’ results.
Middle-Third Distribution of Sales vs. Marketing Cost %
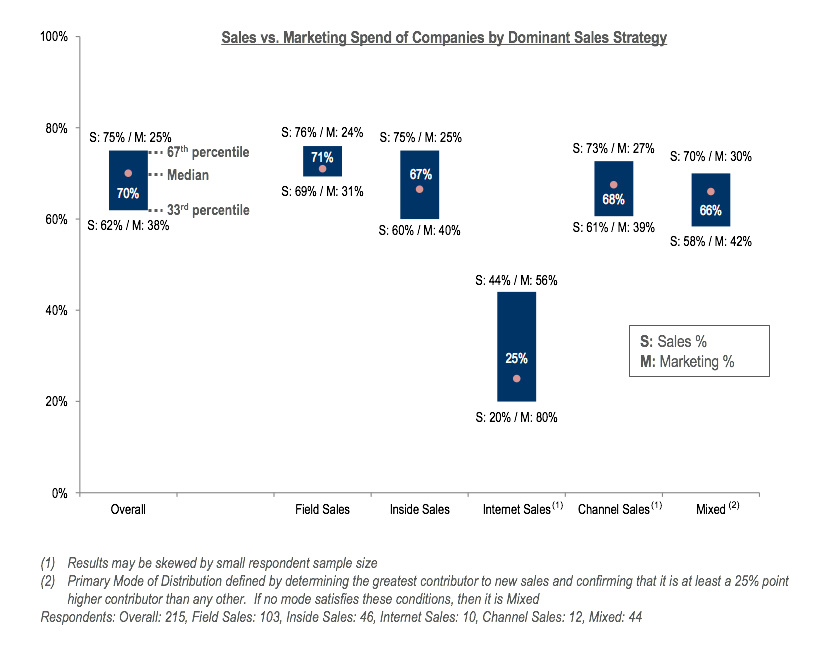
The survey data shows a greater conformity in Sales vs. Marketing spend for Field-sales driven organizations than for Inside sales. Internet sales organizations exhibit even greater diversity in balancing Sales vs. Marketing spend.
CAC Payback Period (Gross Margin Basis)
(Excluding companies <$5MM in 2016 Ending ARR)

Respondents reported an implied median CAC payback of ~18 months, though there was a wide distribution of responses. Results are largely consistent with previous years.
What Percentage of New ARR Is From Upsells & Expansions to Existing Customers?
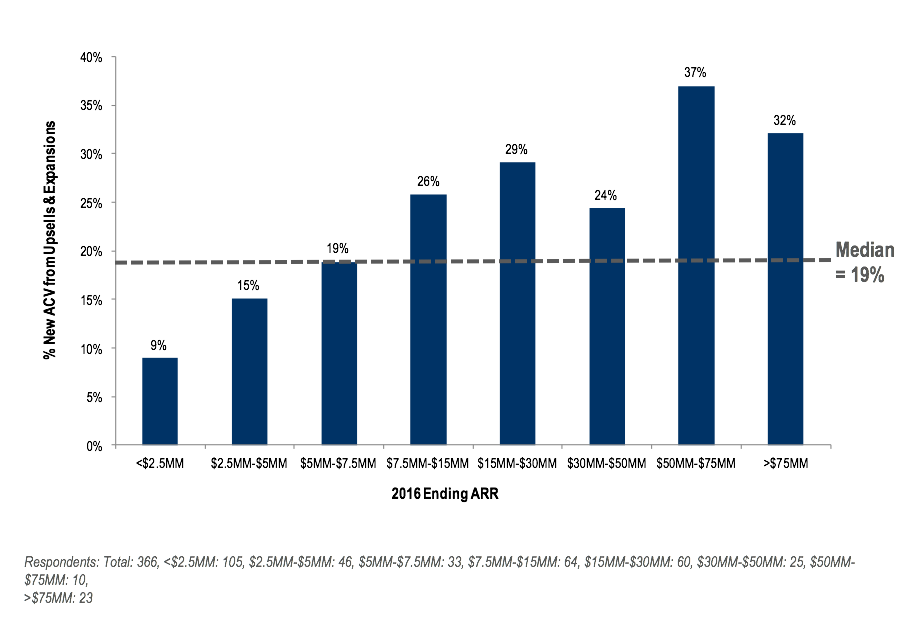
The median respondent gets 19% of new ARR sales from upsells and expansions; larger companies rely more heavily (up to 2x more) on upsells and expansions. This is a similar trend to previous years. However, every group seems to have increased focus and success with upsells and expansions — there are ~5% increases at every level.
Professional Services Role in Go-to-Market
(Excluding companies <$5MM in 2016 Ending ARR)
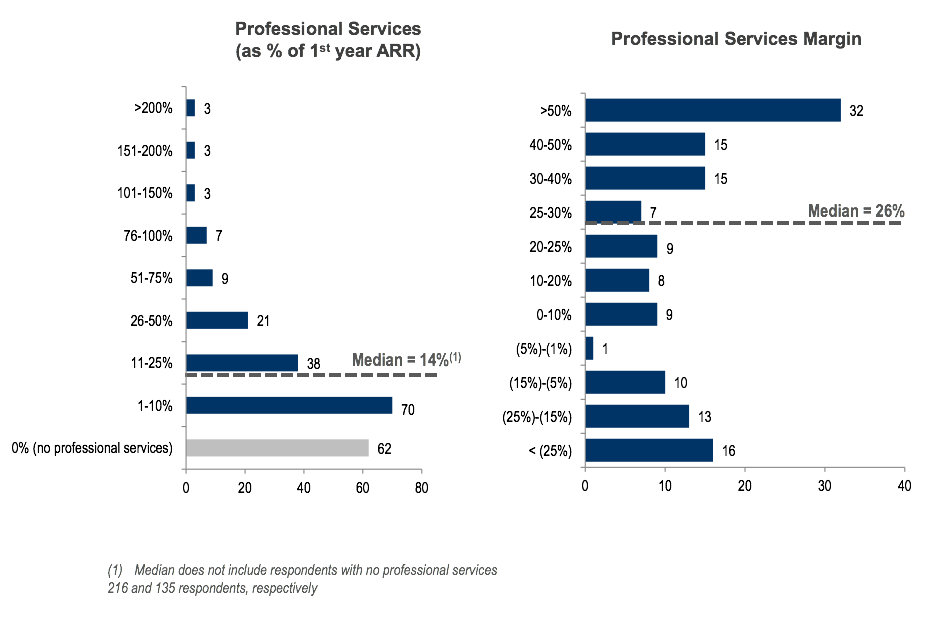
Professional services play a minor role for most, with the median company booking P.S. revenues on new deals equivalent to 14% of first year subscription contract value. Median P.S. margins are approximately 26%. In comparison with previous surveys, P.S. margins increased from ~22% last year to 26% this year.
Professional Services (% of 1st Year ARR) as a Function of Target Customer
(Excluding companies <$5MM in 2016 Ending ARR)
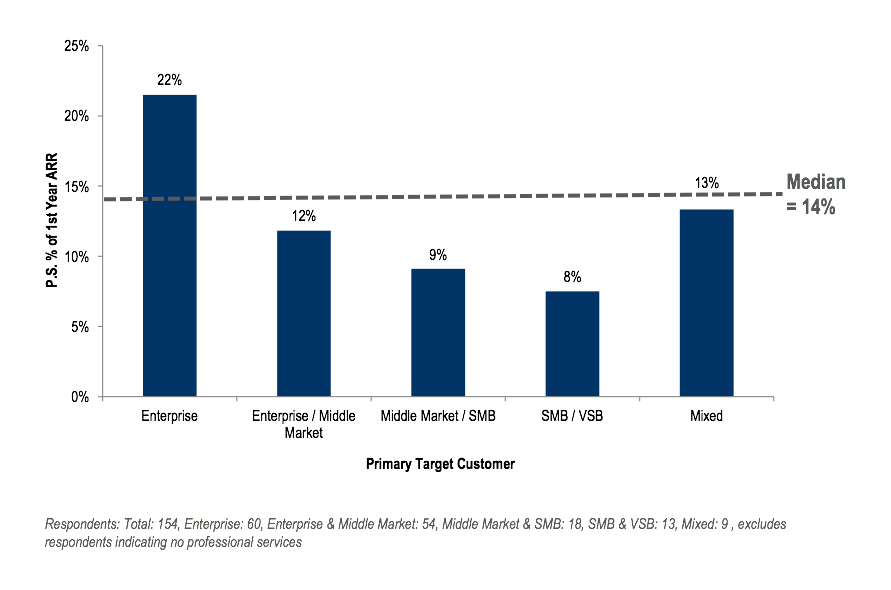
As expected, companies that are mainly focused on enterprise sales have higher levels of professional services. In comparison with previous results, attach rates ticked up for Enterprise (18% in 2016 survey results).
Subscription Gross Margin
(Excluding companies <$5MM in 2016 Ending ARR)
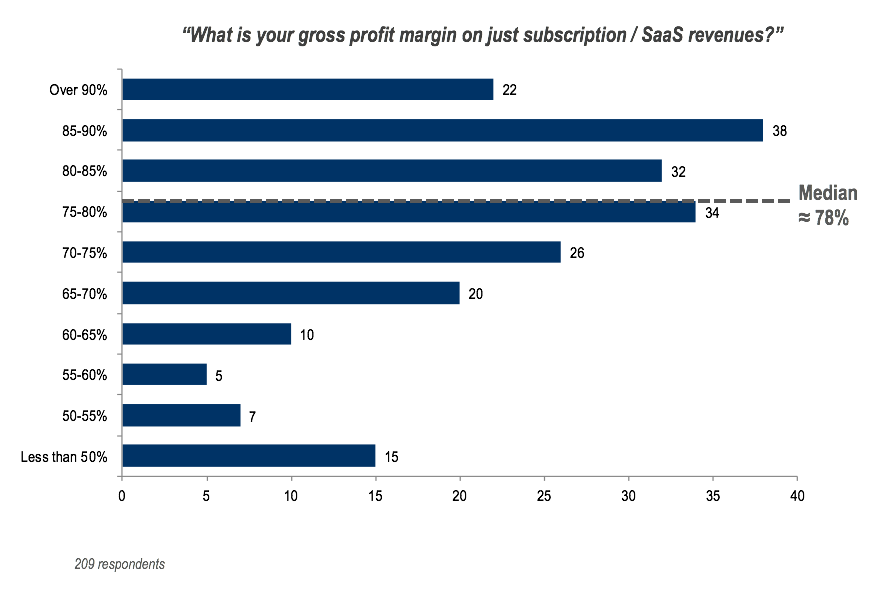
Median subscription gross margins are 78%, which is virtually unchanged from the 2016, 2015, and 2014 survey results.
Direct Sales Commissions by Sales Strategy
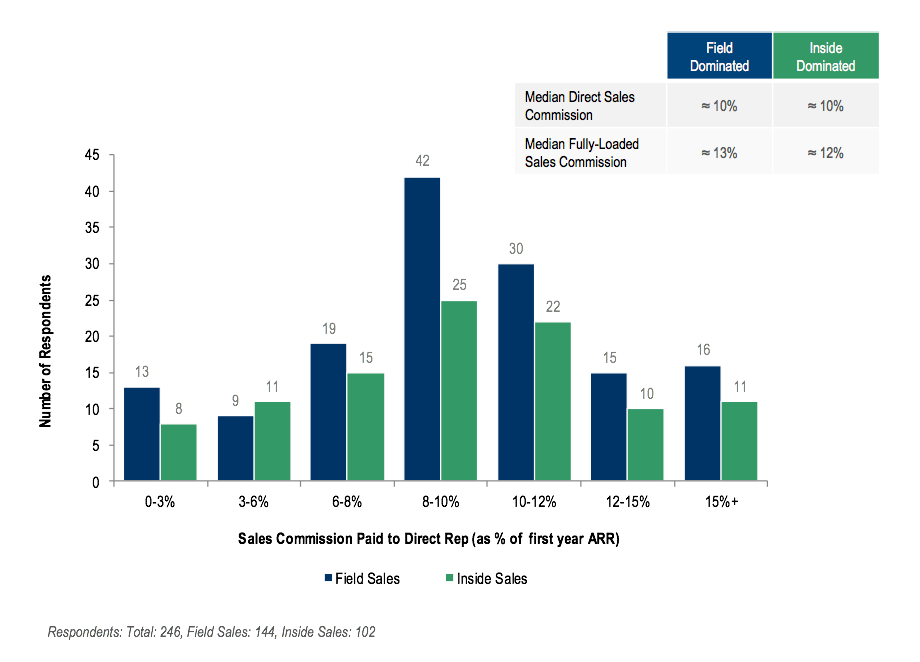
The survey results did not point to a significant difference in direct and fully loaded commissions between companies that predominantly use a Field go-to-market strategy vs. Inside sales.
Sales Commissions as a Function of Median Contract Size
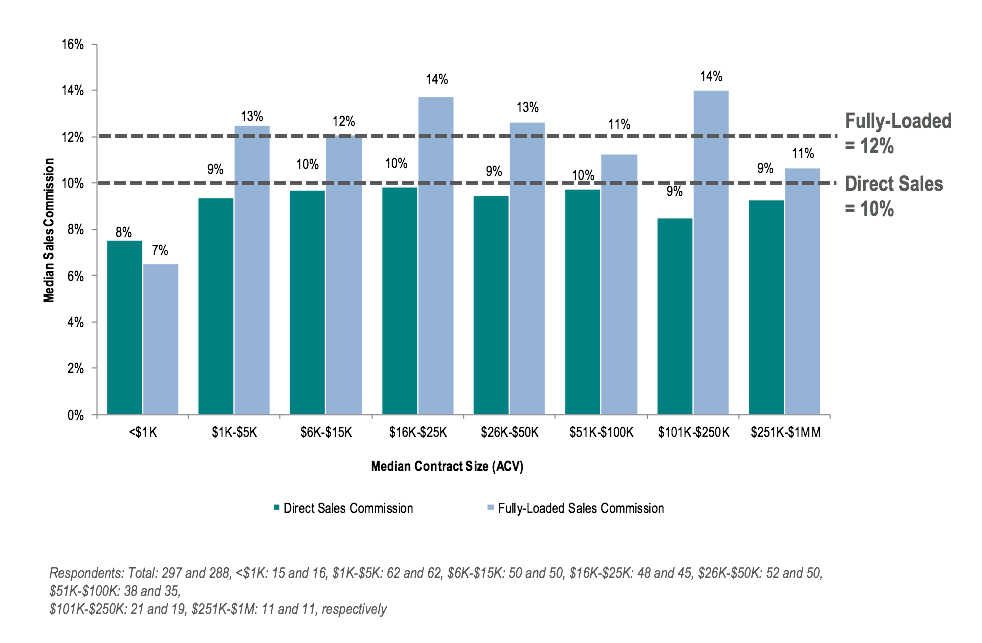
Median Direct sales and fully-loaded commission rates did not vary significantly across contract sizes greater than $1K. Similarly to previous years’ surveys results, there is minimal correlation here.
Commissions for Renewals, Upsells % Multi-Year Deals
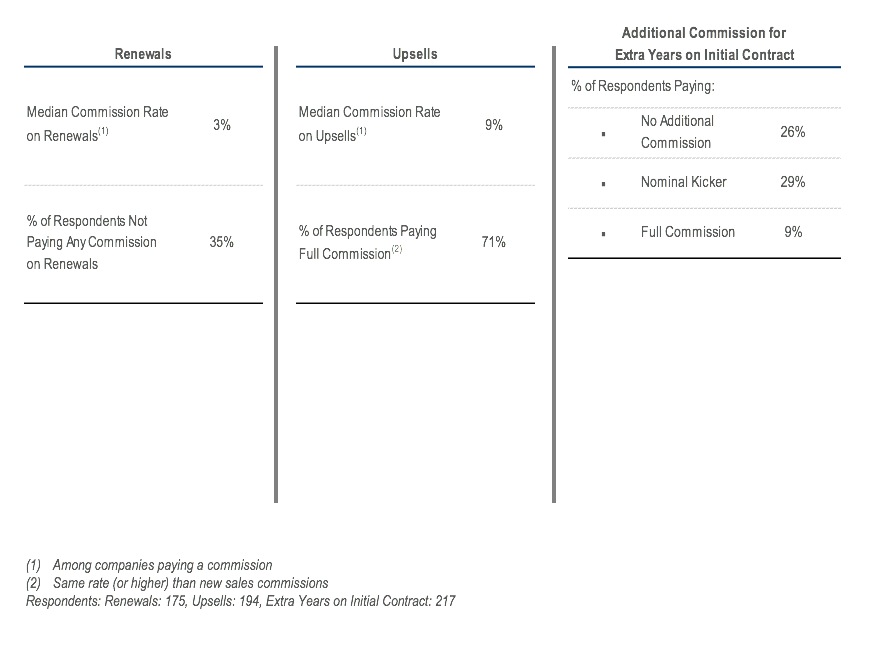
Commissions on renewals are either non-existent or very low. Upsells this year command a commission rate nearly as high as new customer sales. The most significant change this year was with respect to how companies are commissioning upsells with 71% of companies this year providing full commissions on upsells, vs. 59% in last year’s survey results.
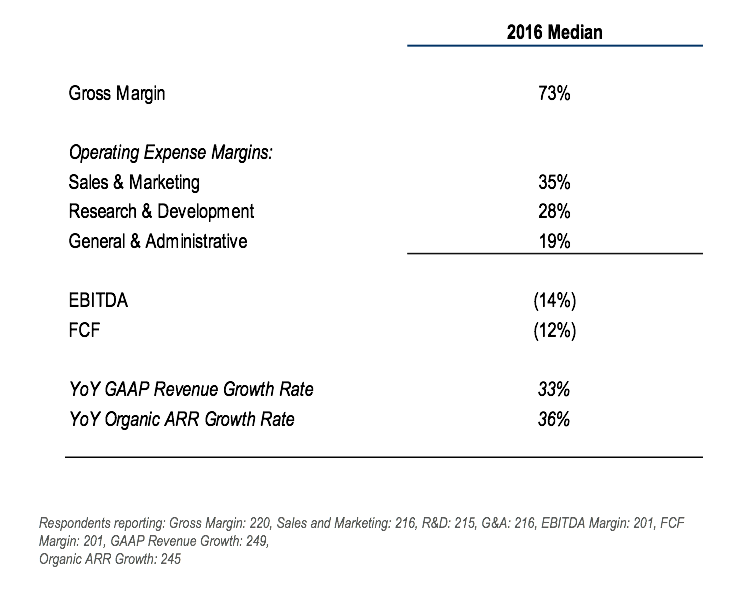
Cost Structure
Cost Structure
(Excluding companies <$5MM in 2016 GAAP Revenue)
Median Cost Structure by Size
(Excluding companies <$5MM in 2016 GAAP Revenue)
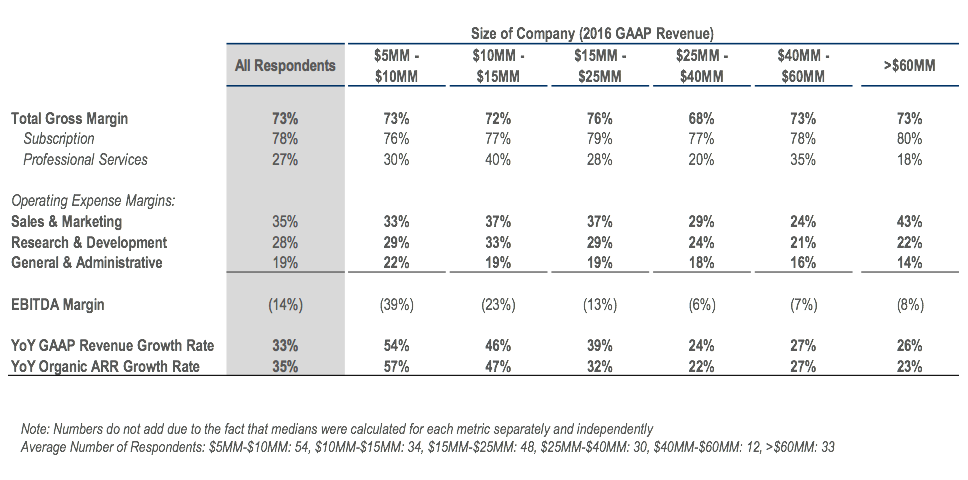
Results are largely in-line with last year’s survey, except for Professional Services gross margin, which was 11% last year for all respondents >$2.5MM, and is 27% this year for all respondents >$5MM.
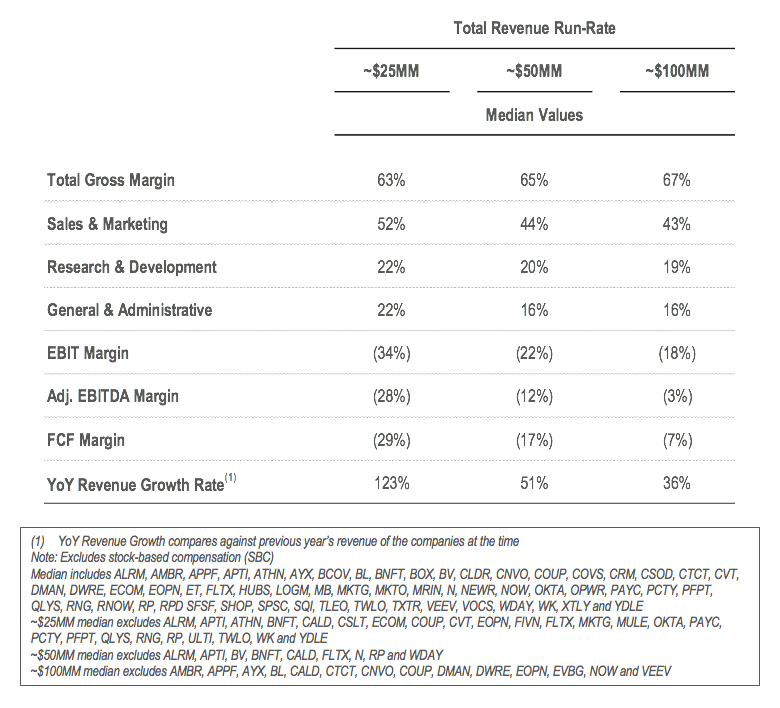
For Comparison: Historical Results of Selected Public SaaS Companies
Measuring Survey Participants Against “The Rule of 40%”
(Excluding companies <$15MM in 2016 Ending ARR)
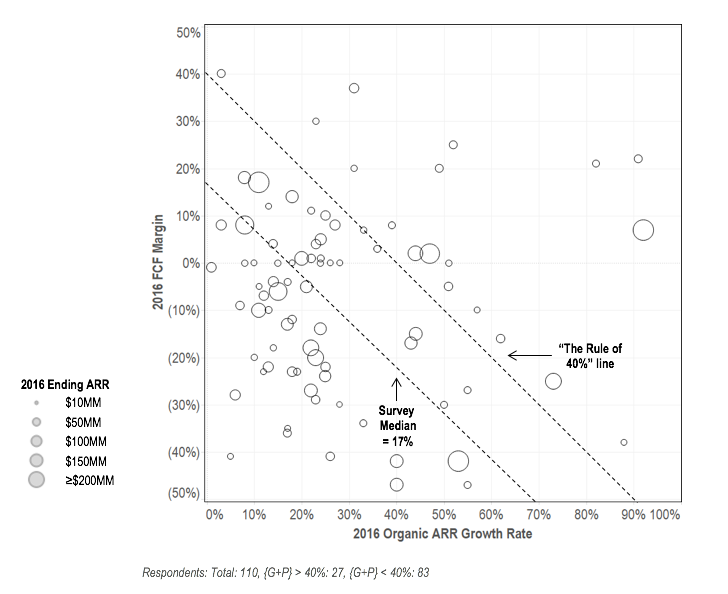
Continuing our theme from last year, we looked at “The Rule of 40%” index of {Growth + Profitability} for companies >$15MMARR. The median G+P index for this group was 17%, or a little less than half the so-called “Rule of 40%” threshold.
Comparison of “The Rule of 40%” Leaders vs. Others
(Excluding companies <$15MM in 2016 Ending ARR)
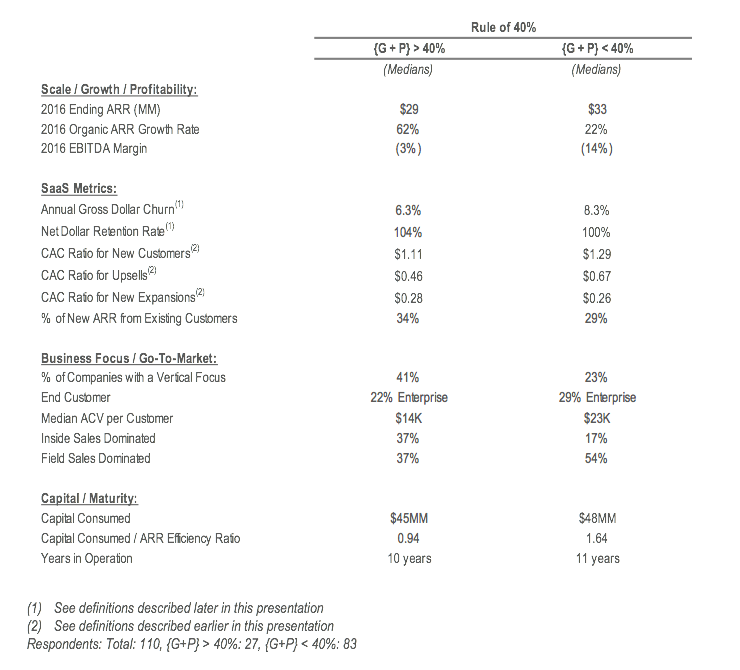
The median results of those respondents meeting or exceeding “The Rule of 40%” showed that while the best G+P performers are of similar size and age, they have significantly better churn, CAC and capital efficiency ratios. Also, more of the high performers comprise a higher percent of vertically-focused vendors and a higher tendency to be Inside-sales driven.
For Comparison: The Rule of 40% For Public SaaS Companies
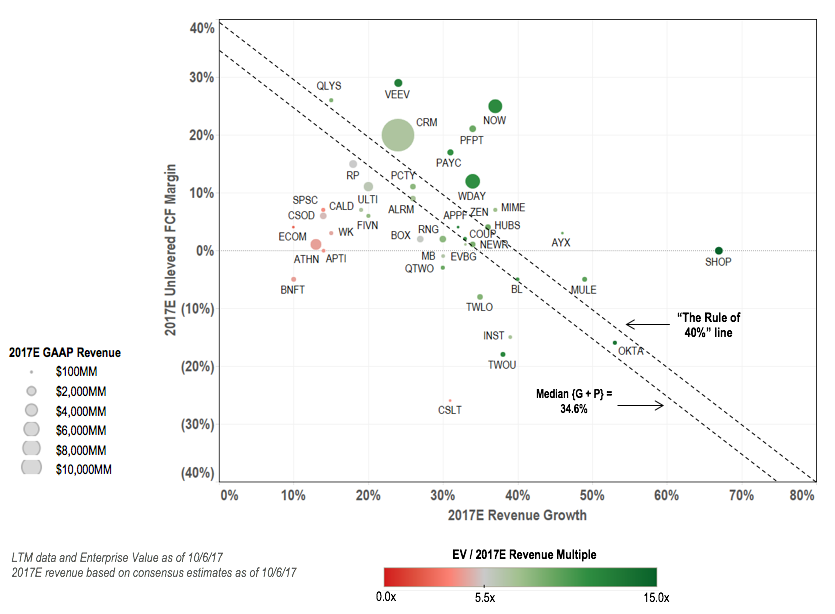
For comparison, public SaaS companies’ median growth + profitability was 34.6%. Notably, 66% of the market cap of public SaaS companies was above the 40% threshold.
I’d love to hear your thoughts and feedback on Part 1 of the SaaS Survey results! Please leave a comment below.
For Part 2 results covering contracting & pricing, retention & churn, capital requirements and accounting policies, click here.
And, check out the forEntrepreneurs 2017 SaaS Infographic which highlights major takeaways from the survey, presented in a visual format.
If you’d like to participate in or receive results from the next SaaS Survey, sign up now:


