
As every SaaS entrepreneur knows, churn is one of the single most important metrics in determining the day to day health of the business. Acquiring new customers is time and capital intensive, and this growth is meaningless if those customers do not stay.
Despite the importance of this metric, measuring, tracking and benchmarking churn often generates a great deal of confusion. A simple search for “SaaS churn” yields over 175K search results with different opinions on the right calculation and benchmarks to use. Two of the most common questions we receive tend to be around 1) calculating these metrics on your actual user data 2) benchmarks for each of these rates. I’ll aim to address both these questions in this post and have also included a google spreadsheet with an illustrative customer data set that goes through each calculation.
Businesses will typically track and measure three churn rates on an ongoing basis: customer churn, gross dollar churn and net dollar churn. Since each metric helps highlight a different trend that may be happening with your users, it makes sense to track all three. To keep it simple, our dummy data set only includes 30 customers. Thus, likely similar to any early stage business, there will be a great deal of fluctuation in the churn numbers that will smooth out as a business grows.
Customer Churn (Logo Churn)
Definition: This metric measures the number of customers you lose over a period of time. I’ve calculated this number on a monthly basis in the “Churn Calculations” tab. The formula behind the calculation is:

Tracking the reasons customers are leaving can be even more important than tracking this number itself. Particularly, when selling to early-stage startups, you may experience involuntary churn (e.g., a customer goes out of business or gets acquired), which you may not be able to control. This churn is different from voluntary churn (e.g., customer dislikes the product and chooses to cancel or picks a competitor), which is important to mitigate.
Benchmarks: These numbers tend to significantly vary based on the type of customers you are acquiring (e.g., the numbers for a prosumer subscription business would be very different than those of a SaaS business selling to the Fortune 1000). We typically spend less time looking at customer churn benchmarks internally.
Gross Dollar Churn
Definition: This metric looks at your total lost revenue both from customers churning and from downselling (e.g., your customer on the $1000/mo plan downgrades to the $100/mo plan). I’ve calculated this number on a monthly basis in the “Churn Calculations” tab. The formula here is:
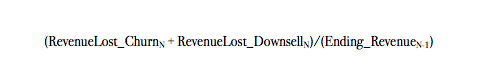
The difference between the customer and gross dollar churn numbers also highlights the importance of tracking both metrics. As you can see from the raw numbers, my example business is good at retaining its $100 customers but loses many of its larger $1000 and $2000 businesses, a trend you might miss if you were only tracking customer churn.
Benchmarks: Best-in-class gross dollar churn is typically less than 1% on a monthly basis. It is important to note that at early stages of a company when customer numbers are small, there will be a good amount of variation on a month-to-month basis (as my spreadsheet highlights). However, over time, it should be easier to get a feel for a longer-term churn rate for the business.
Net Dollar Churn
Definition: This metric looks at the revenue you are losing from customers churning or down-selling less the gains from upsell (effectively, the change in your monthly recurring revenue excluding new bookings). I’ve calculated this number on a monthly basis in the “Churn Calculations” tab. The formula here is:
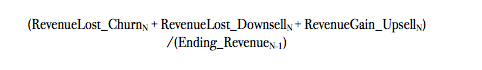
As you can see, in months where there is more upsell than downsell and churn, you get a negative net dollar churn rate.
Benchmarks: The best-in-class benchmark for this metric is negative net dollar churn — these companies will still grow even if they did not acquire a single new customer. We saw this behavior with Zendesk, one of our portfolio companies. Once a business purchases Zendesk, it typically increases its spend with the product as it brings more agents onto the platform. At the Series A, however, there are many successful businesses that may have not yet experimented with pricing and packaging and may not see a negative net churn rate until they are further along.
For more discussion on churn, you may find the following articles to be of interest:


