
For the fourth year in a row, we worked together with Pacific Crest Securities, an investment banking firm with a specific focus on SaaS, to survey 305 SaaS companies. This survey represents deep benchmarking data and insights on the growth and operations of the companies in this space.
I want to extend my personal thanks to the many readers of this blog who participated in the survey. My thanks also go out to David Spitz and his team at Pacific Crest Securities (@dspitz and @PacCrestSec on Twitter) for their hard work on the survey. To learn more about Pacific Crest Securities or download the full report, click here.
Part 1 of the results of the survey, which focuses on growth rates and go-to-market trends, are posted below. Part 2 of the results, which compare application delivery methods, operational costs and gross margins, contract terms, churn rates, capital requirements and accounting methods, can be found here.
We’re also excited to share the forEntrepreneurs SaaS Survey Infographic, which highlights major parts of this year’s SaaS Survey results.
Info about the Survey Participants
This year’s survey results include responses from senior executives of a broad diversity of 305 SaaS companies:
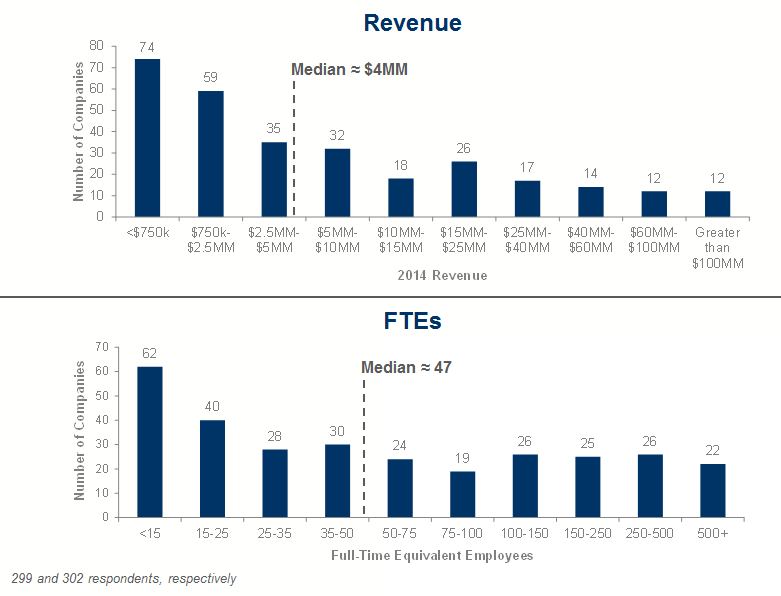
- $4MM median revenues, with 133 companies >$5MM and 57 >$25MM
- 47 median full-time employees (range of 2 to 1,200)
- Median customer count of approximately 300; 28% of respondents have >1,000 customers
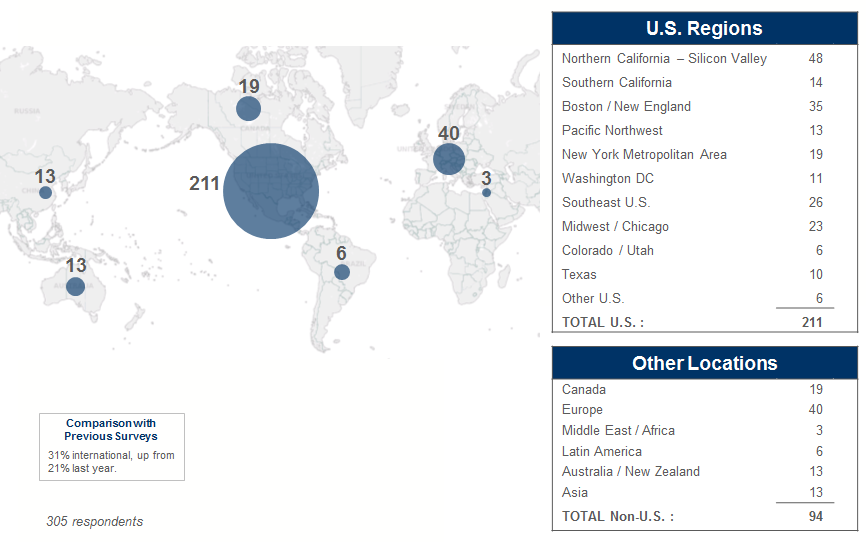
- 70% of participants were headquartered in the U.S.
- $21K median annual contract value (ACV), with 21% of participants below $5K and 17% above $100K
- Good mix of field sales (41% use as predominant mode), inside sales (21%), as well as Internet, channel, and mixed modes
Survey Participant Geography
Survey Participant Size Distribution
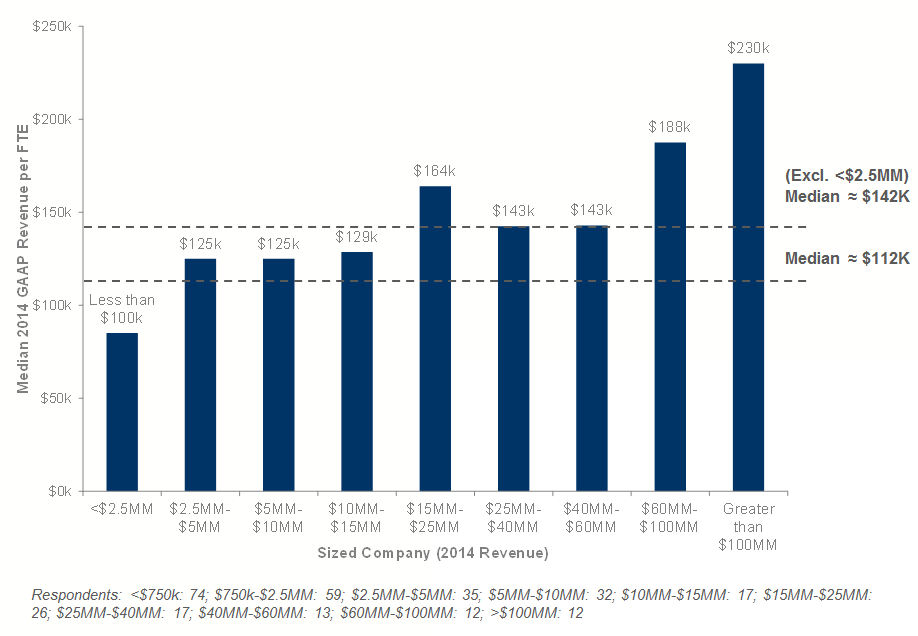
Revenue per FTE Efficiency
Growth Rates
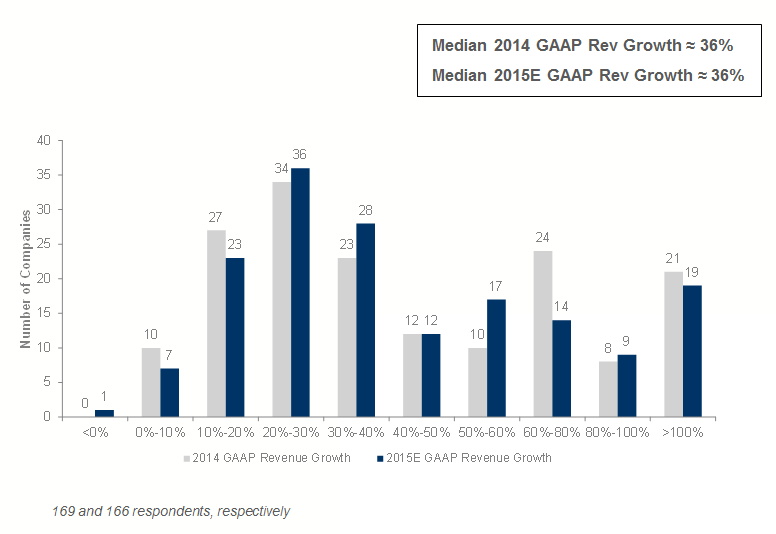
How Fast Did / Will You Grow GAAP Revenues?
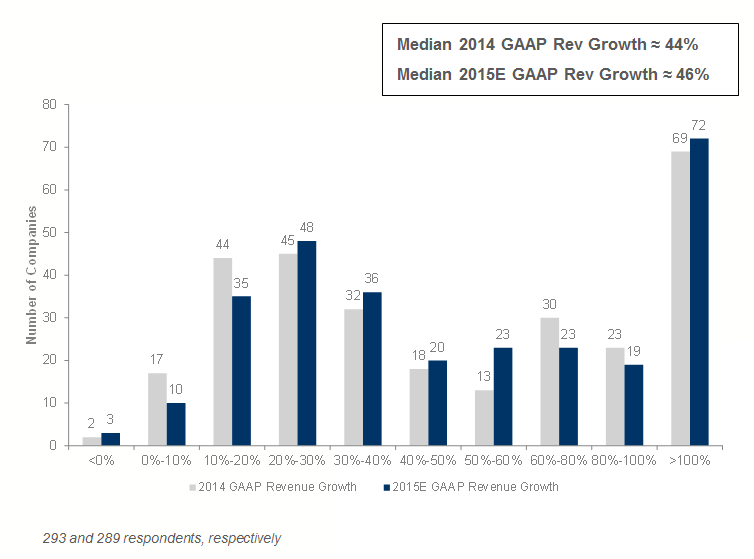
This year’s results are markedly up from medians of 37% and 42% growth for 2013 and 2014E, respectively, reported in last year’s survey, and closer to the 2013 survey results (41% and 47% for 2012 and 2013E growth, respectively).
How Fast Did / Will You Grow GAAP Revenues? (Excluding companies <$2.5MM in Revenue)
As expected, many of the fastest growers are among the smallest companies. Eliminating them brings median growth rates down approximately 10% points.
Median Growth Rate as a function of Size of Company (Excluding companies <$2.5MM in Revenue)
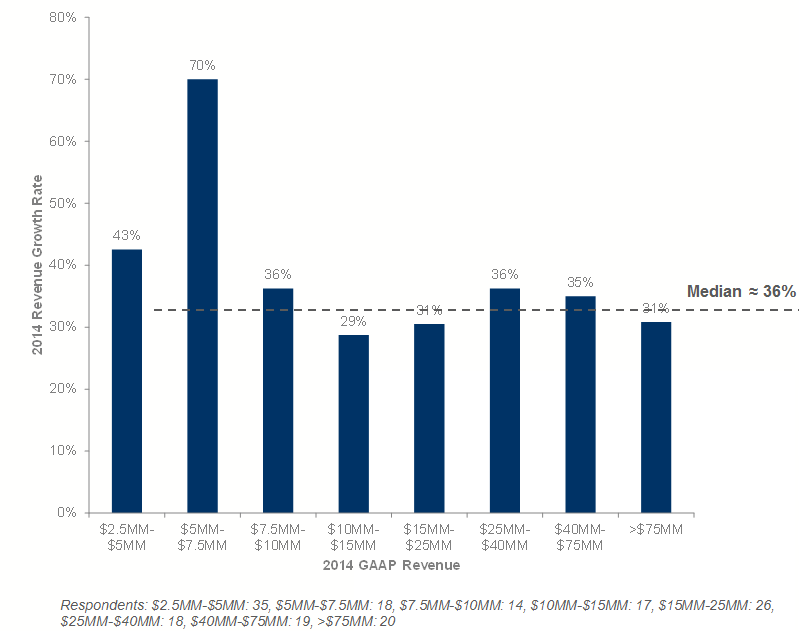
The results indicate that companies in the $5-$7.5MM range are among the fastest growers – with the median much greater than the median of companies half their size. We saw a similar phenomenon of a bump-up last year for companies at this size, although our data was not as finely segregated (the bump-up group was $5-$10MM).
Median Growth Rate as a function of Size of Company – Middle Third Group (Excluding companies <$2.5MM in Revenue)
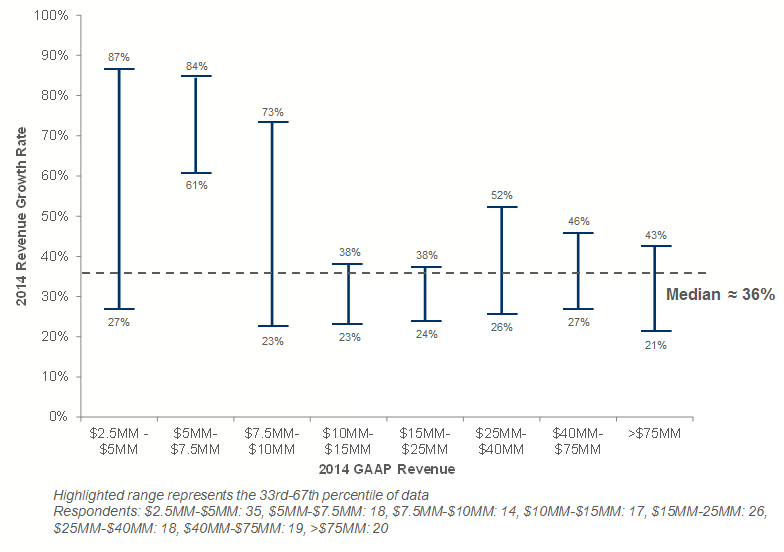
Looking at the middle third of respondents in each size group suggests that the $2.5-$5MM companies are also among the fastest growers.
Median Growth Rate as a function of Contract Size (Excluding companies <$2.5MM in Revenue)
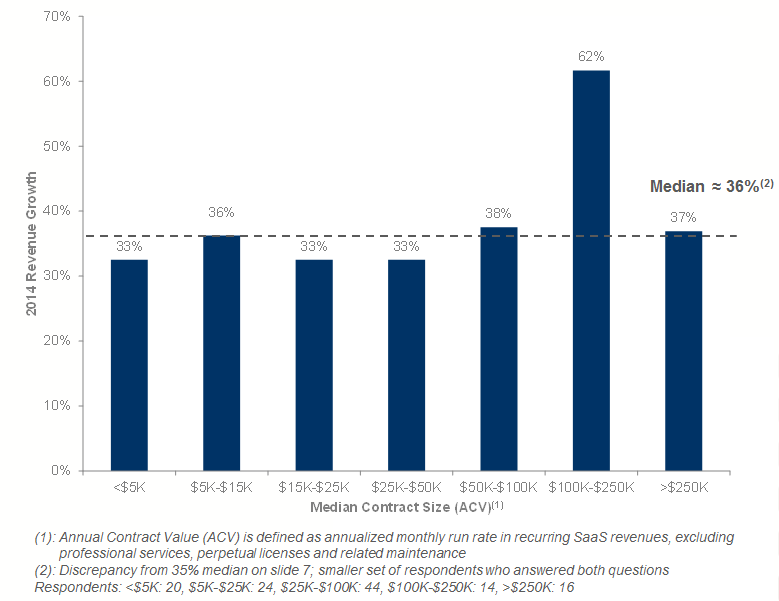
Last year, the bump-up occurred for companies in the ranges encompassing $5K-$100K ACV. There appears to be no relationship between median contract size and growth other than a bump-up for the $100K- $250K group (though this could be skewed by sparse data in that group).
Median Growth Rate as a function of Sales Strategy (Excluding companies <$2.5MM in Revenue)
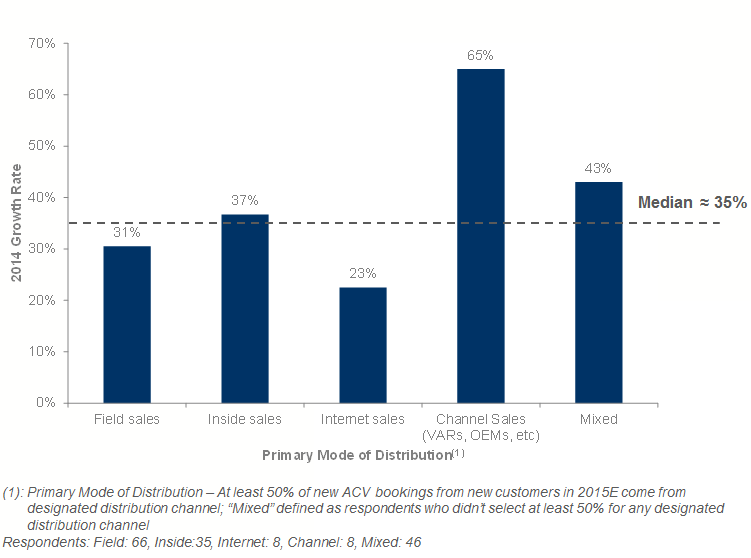
Compared with previous surveys, field sales lagged inside sales by a greater amount this year (6% in 2015 vs. an insignificant 2% difference in 2014). Median growth among field sales dominated companies slightly lagged inside sales dominated companies (by 6% points), but led internet sales by 8% points. Channel sales dominated companies grew significantly faster, though the data is sparse. Mixed also performed well.
Median Growth Rate as a function of Target Customer(1)
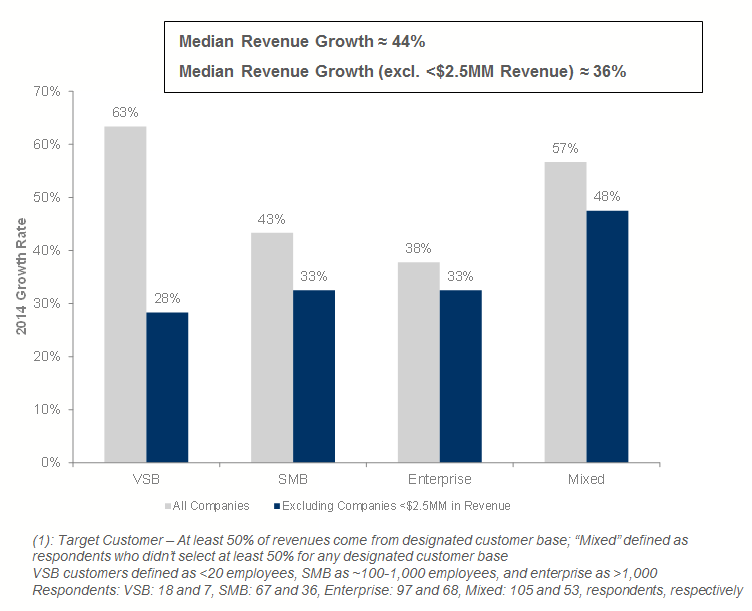
A big change for the “mixed” group compared to previous surveys. Last year’s survey showed no advantage for mixed / balanced target customer companies. Companies with mixed/balanced target customer strategies are growing the fastest. Otherwise, at least for companies >$2.5MM in revenues, there aren’t significant differences.
Go-to-Market
Primary Mode of Distribution
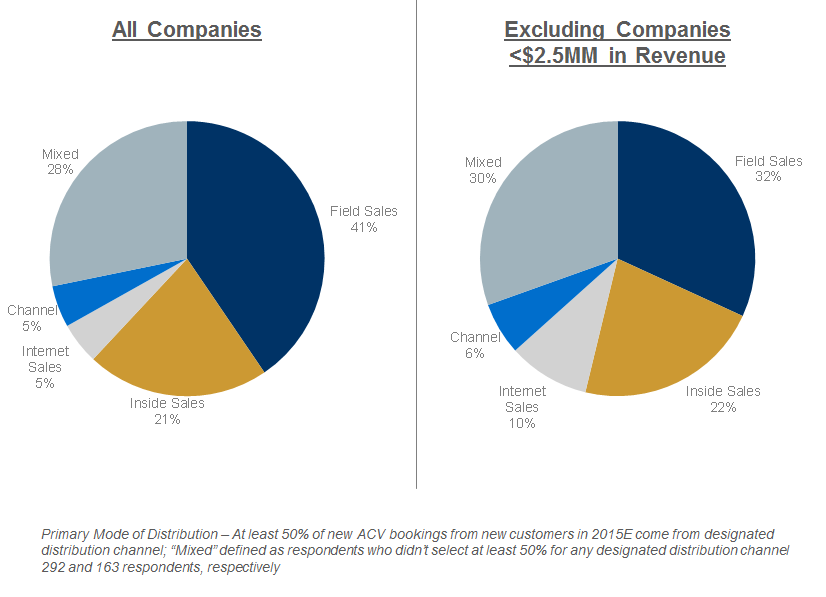
Results were very similar to previous survesy. Compared to last year, there was a slight shift away from inside sales strategies towards mixed distribution models. Field sales remains the most popular way to sell, with 41% of participants employing it as their primary mode of distribution (32% if we exclude companies with <$2.5MM in revenues). I’m surprised by this as most of the companies that I work with are primarily using inside sales, and I see very few companies using primarily field sales. This may be explained by the chart below which shows that field sales is predominantly used in situations where the average initial contract is over about $75k.
Primary Mode of Distribution as a Function of Median Initial Contract Size
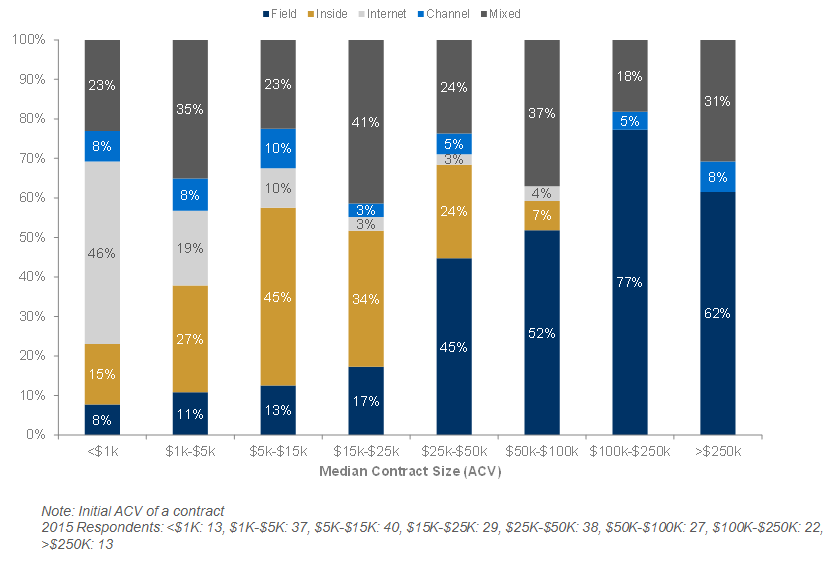
Compared to last year, results are very similar, except for companies with median ACVs over $250K, where in this year’s results, we see noticeably more companies using inside sales. Analyzed by contract value, field sales dominates for companies with median deals over $50K and more or less disappears when median deal sizes are below $15K. There’s meaningful bifurcation among the $15K-$25K and $25K-$50K groups.
CAC(1): How Much Do You Spend for $1 of New ACV from a New Customer? (Excluding companies <$2.5MM in Revenue)
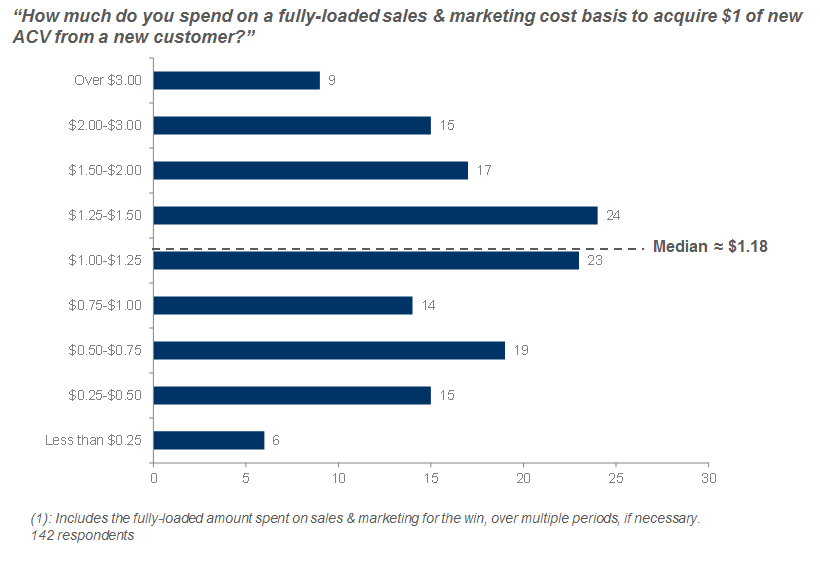
The median result is notably higher than compared to previous surveys, where the $1.07 and $0.92 were reported in the 2014 and 2013, respectively. Respondents (excluding the smallest companies) spent a median of $1.18 to acquire each dollar of new ACV from a new customer. The result drops to $1.06 if we include companies with <$2.5MM in revenues.
Note to regular ForEntrepreneurs readers: the way that CAC is measured in the question above is different to how I normally measure CAC in my other blog posts e.g. “SaaS Metrics 2.0 – A Guide to Measuring and Improving What Matters“. In those posts CAC is the average amount that it costs to acquire a single customer. In the question above, CAC is measured as the cost to acquire a dollar of ACV (annualized contract value). This is very similar to my metric: “Months to recover CAC”. i.e. if it costs you a dollar to acquire a dollar of ACV, then it will take you 12 months to recover that CAC. For the median in the graphic above of $1.07 to acquire a dollar of ACV, that means it will take 12 x 1.07 = 12.84 (or about 13 months to recover.)
CAC on New Customers vs Upsells vs Renewals (Excluding companies <$2.5MM in Revenue)
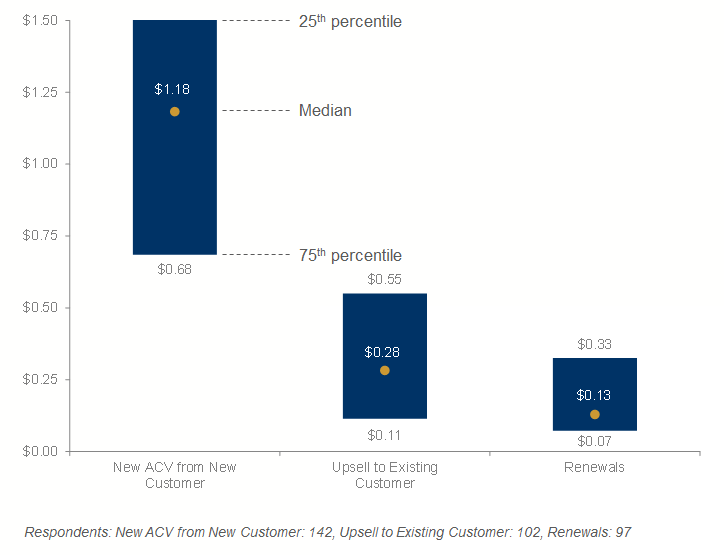
The cost of upsells ($.28) has increased compared to previous surveys from the $.18 reported in 2014, while the cost of renewals remains almost identical. The median CAC per $1 of upsells is $0.28, or about 24% of CAC to acquire each new customer dollar. The CAC for renewals is $0.13, or 11% of the CAC to acquire each new customer dollar.
CAC Spend by Primary Mode of Distribution
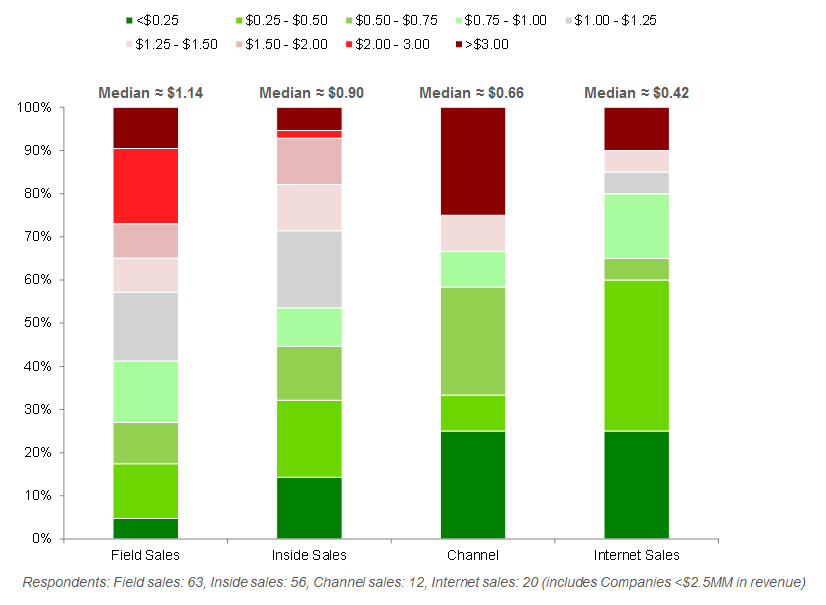
As expected, field sales has the most expensive CAC at $1.14, followed by inside sales at $0.90. Channel and online distribution have significantly lower CACs at $0.66 and $0.42, respectively. Compared to previous years, all modes have shown increases except Internet, which is down from $0.54 to $0.42.
CAC Composition: Sales vs. Marketing Cost % of CAC
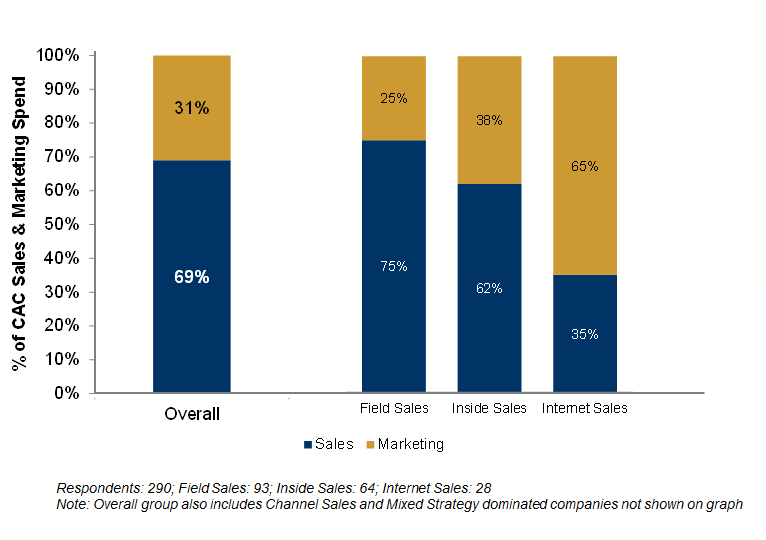
Overall, the median company devotes 31% of their CAC to Marketing expenses, with the remaining 69% allocated to Sales. However, Inside Sales- and Internet Sales-driven companies have a much greater reliance on Marketing, with 38% and 65% of their CAC budgets devoted to Marketing, respectively.
CAC Payback Period (Gross Margin Basis)
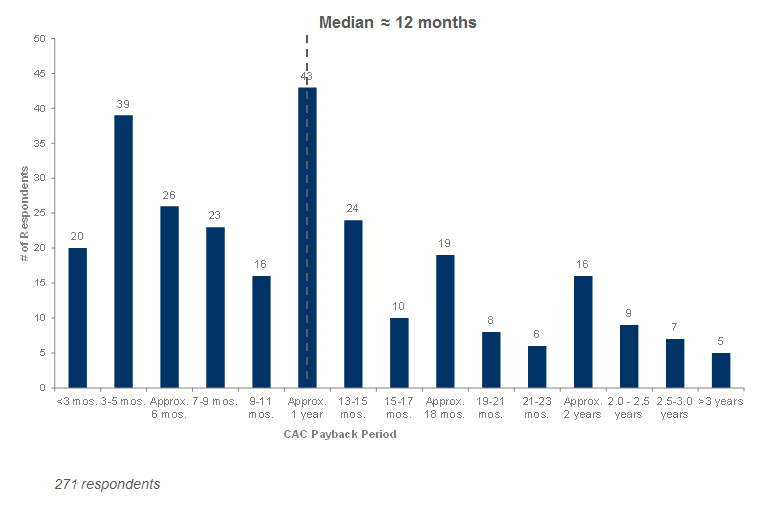
For the first time we asked about CAC payback period (defined as # of months of subscription gross profit it takes to recover the fully loaded cost of acquiring the customer). Respondents reported a median CAC payback of ~12 months, though we note a wide distribution of responses.
Median CAC Payback Period by Primary Mode of Distribution
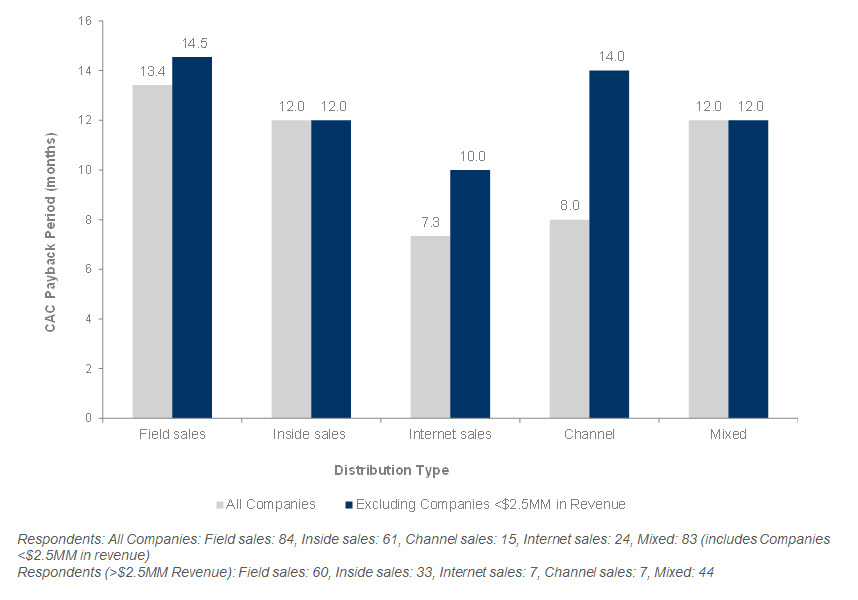
Field Sales-dominated companies have 20% longer CAC payback periods than those primarily using Inside Sales, which in turn have approximately 20% longer CAC payback periods than those relying primarily on Internet Sales.
What Percentage of New ACV is from Upsells to Existing Customers?
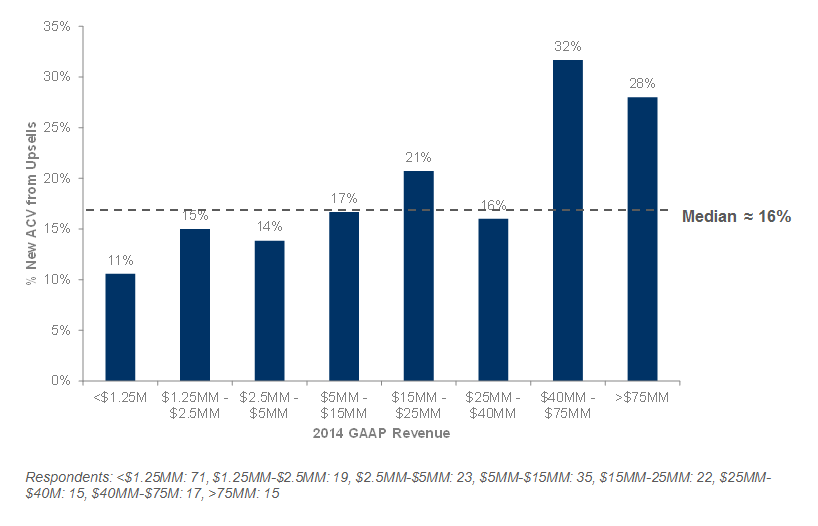
The median respondent gets 16% of new ACV sales from upsells; larger companies rely more heavily on upsells. This is largely consistent with prior years’ results.
Are the Fastest Growing Companies Relying More on Upsells? Yes…

Almost across the board, the fastest growers tended to have noticeably more reliance on upsells. This year’s results 2014 a similar result compared to previous years for companies above $10MM but not below. Now the fastest growing smaller companies are also focusing on upsells.
Professional Services Impact on Go-to-Market (Excluding Companies <$2.5MM in Revenue)
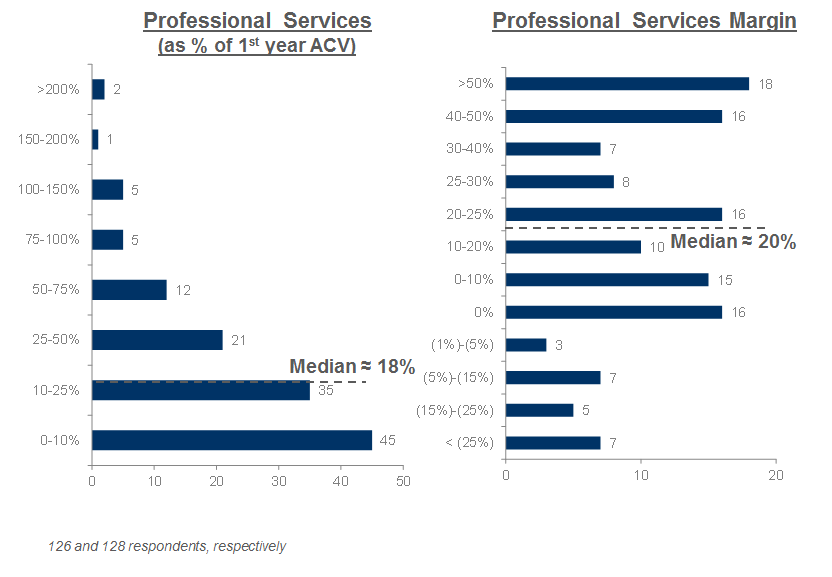
Professional services play a minor role for most, with the median company booking P.S. revenues on new deals equivalent to 18% of first year subscription contract value. Median P.S. margins are approx. 20%. Compared with previous surveys, median attach rates are up, from 13% in the 2014 survey to 18% this year. Margins are unchanged.
Professional Services (% of 1st Year ACV) as a Function of Target Customer (Excluding Companies <$2.5MM in Revenue)
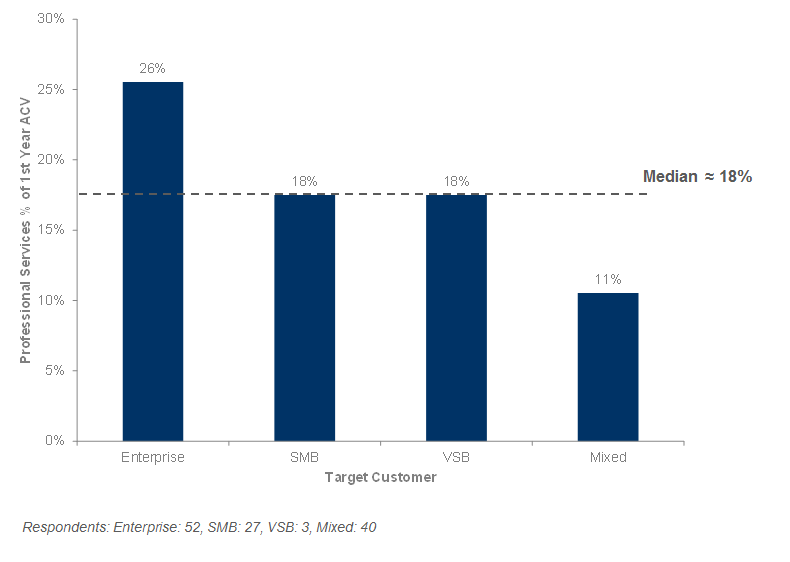
Compared with previous surveys, attach rates ticked up significantly across the board (2014 survey: Enterprise 18%, SMB 8%, VSB 6%, Mixed 9%). As expected, companies which are focused mainly on enterprise sales have higher levels of professional services.
Subscription Gross Margins: “What is your gross profit margin on just subscription/SaaS revenues?”
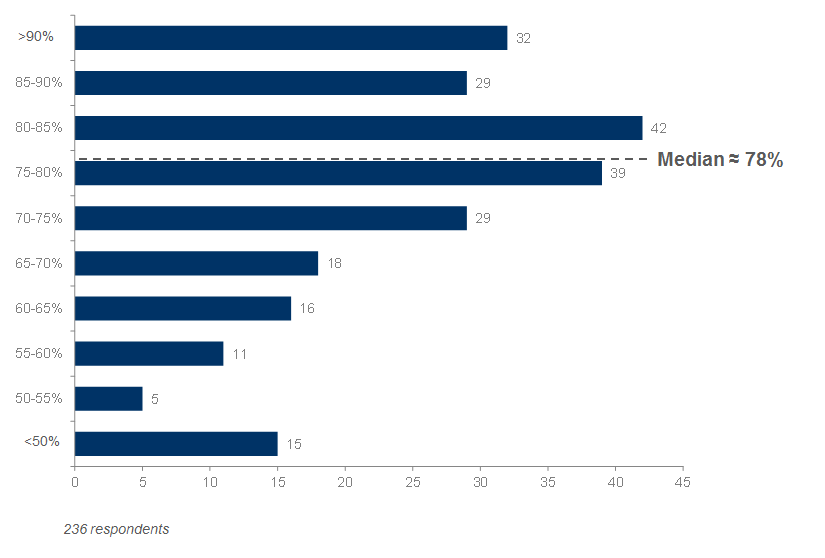
Median subscription gross margins are 78% (nearly identical when removing the smallest companies from the group). These numbers are virtually unchanged from the 2014, 2013 and 2012 results.
Freemium / “Try Before You Buy”
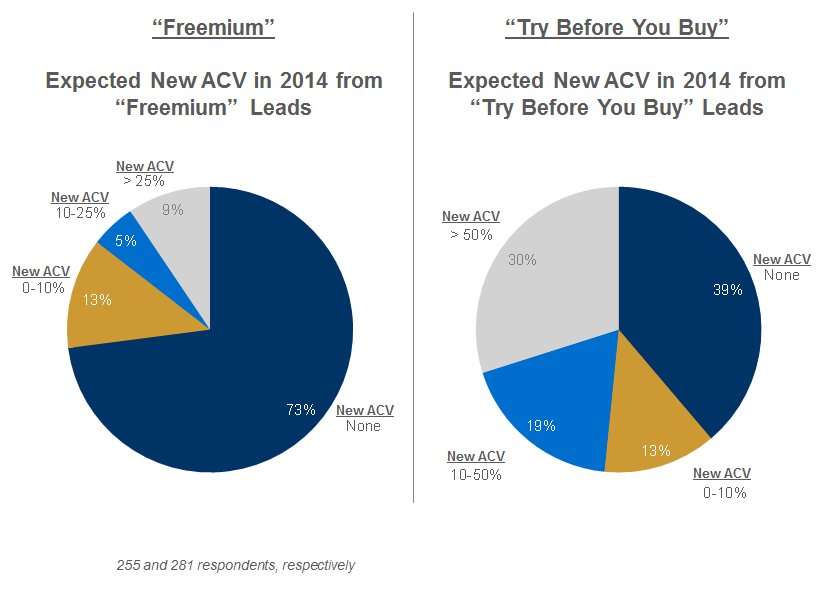
Approximately 30% of companies derive some amount of new ACV from “freemium” strategies, though virtually no one drives their business on it. “Try Before You Buy” is much more commonly used: 60% derive revenues through this strategy, and 30% derive the majority of their new ACV through “Try Before You Buy”. These results are very consistent with previous years.
Sales Commissions
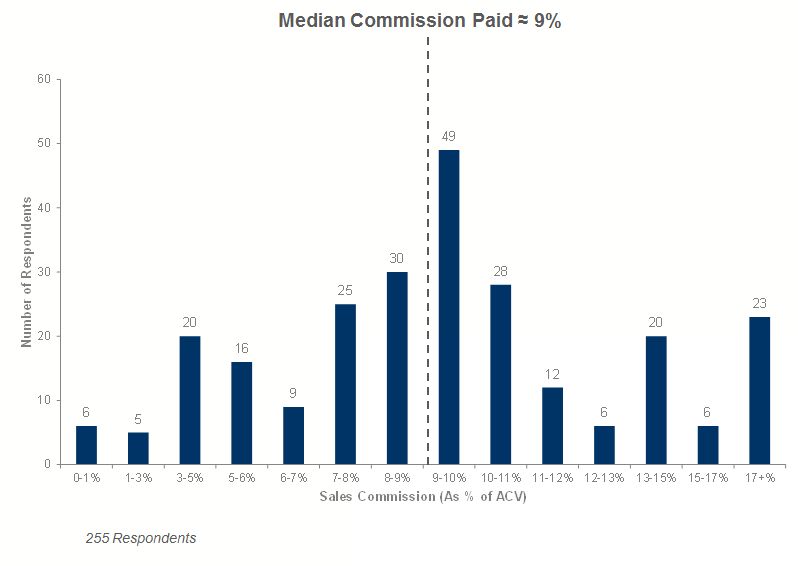
These numbers are consistent overall with 2014, 2013 and 2012 results, though granular bucketing of potential survey responses this year resulted in additional detail. The median reported sales commission rate for the group is approx. 9% of ACV.
Sales Commissions by Sales Strategy
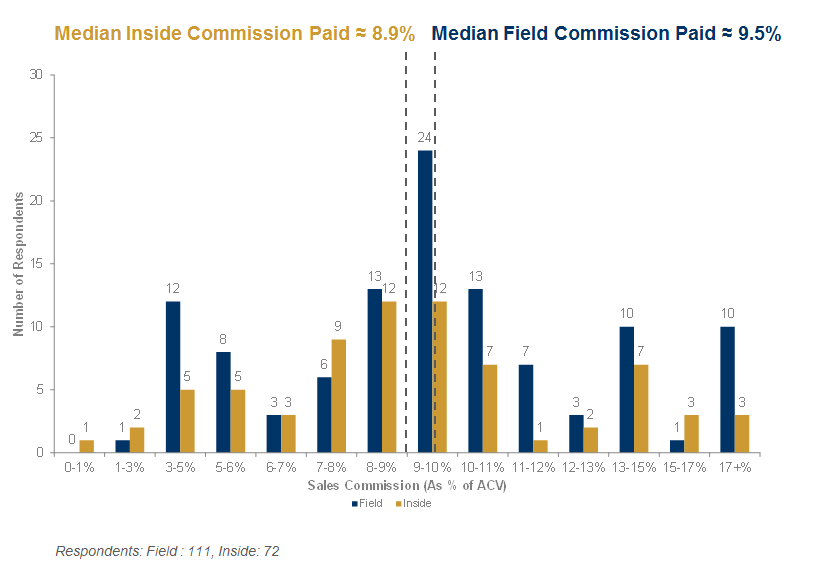
The survey results indicate that median sales commission rates are only slightly higher for Field Sales versus Inside Sales. Similar to 2014 survey results, though granular bucketing of potential survey responses this year resulted in additional detail.
Sales Commissions as a Function of Median Contract Size
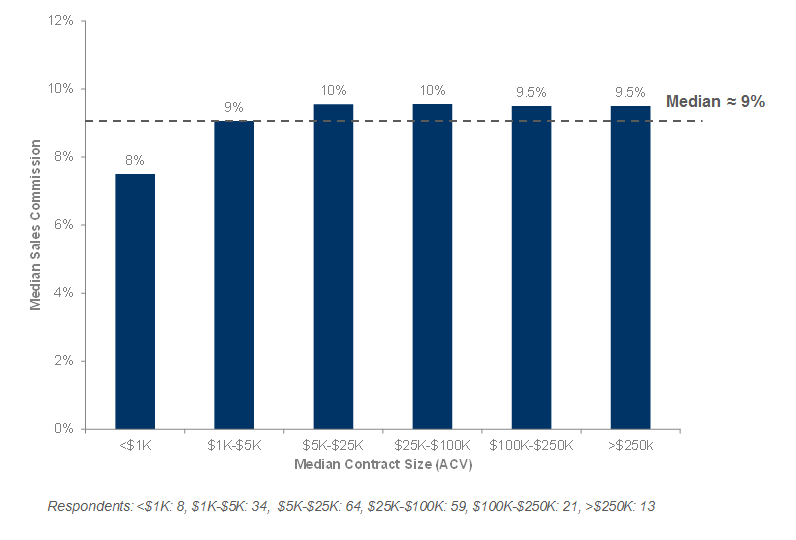
In 2014, “Elephant hunters” (>$250k median ACV) had materially lower commission rates (7%). We note that the 2015 results are consistent with results from two years ago. There was a high degree of consistency in commission rates across contract sizes.
Commissions for Renewals, Upsells and Multi-Year Deals
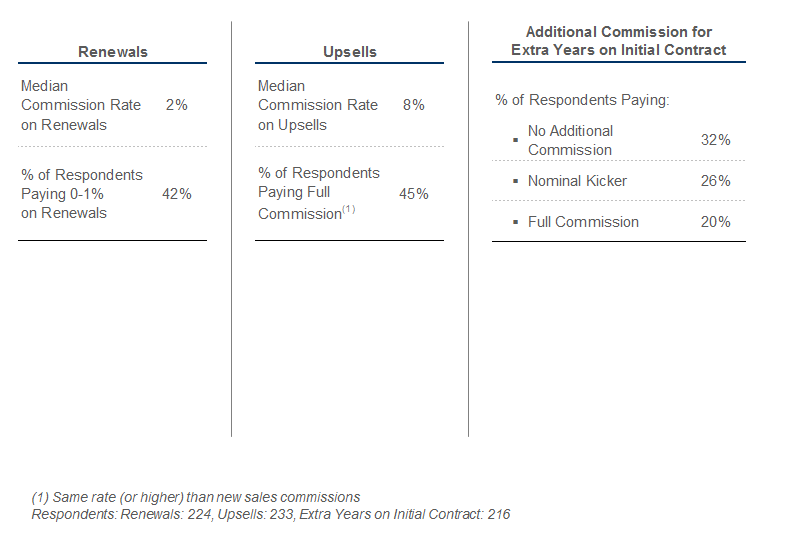
The most significant changes this year include: 1) Upsells: this year just 45% paid full commission rates on upsells, vs. 58% in last year’s group; 2) This year just 32% paid no additional commission on longer term contracts vs. 42% in last year’s group. Not surprisingly, commissions on renewals are typically deeply discounted, with a median rate of 2%. Upsells command a median rate of 8%, and nearly half of the companies pay full commissions on upsells.
Effect of Renewal Commission Rates on Churn (Excluding Companies <$2.5MM in Revenue)
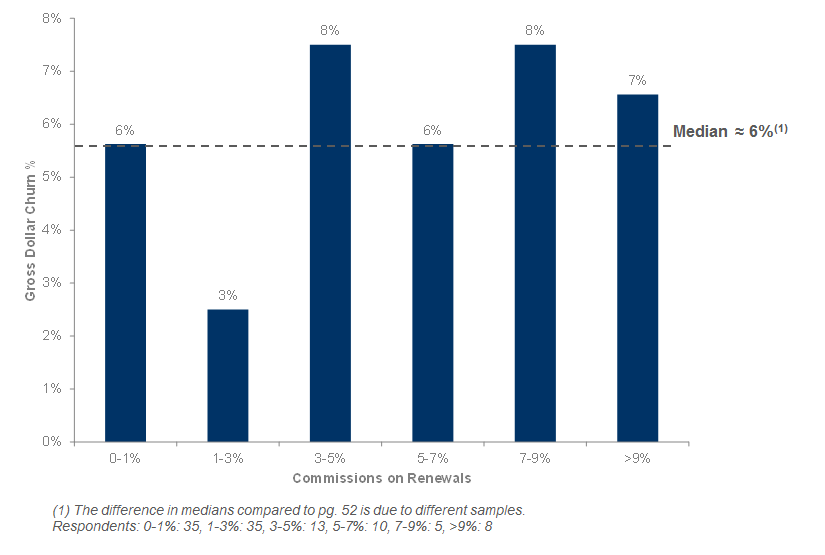
One natural question to ask is whether companies which pay higher commissions on renewals experience lower churn. The following chart suggests that there is little correlation between commissions on renewals and gross churn.
Median Growth Rate as a Function of Commissions on Renewals (Excluding Companies <$2.5MM in Revenue)
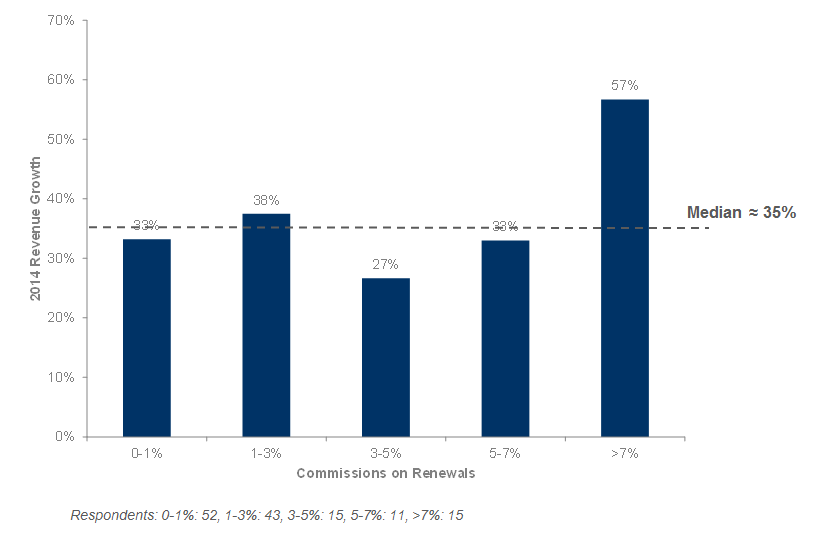
Companies offering 7% or greater commissions on renewals have experienced the highest growth rate.
More in Part 2 Survey Results…
If you are interested in SaaS metrics and benchmarking your firm, you may also find the following blog post to be of interest:
SaaS Metrics 2.0 – A Guide to Measuring and Improving What Matters
Ready for more? Part 2 of the SaaS survey has been published, and compares application delivery methods, operational costs and gross margins, contract terms, churn rates, capital requirements and accounting methods.
We’re also excited to share the forEntrepreneurs SaaS Survey Infographic, which highlights major parts of this year’s SaaS Survey results.


