
Last week I posted the results from Part 1 of our survey in which 300+ SaaS companies shared data on their growth and go-to-market strategies. This week I’m sharing the results from Part 2 of the survey where we compare application delivery methods, operational costs and gross margins, contract terms, churn rates, capital requirements and accounting methods.
We’re also very excited to share the forEntrepreneurs SaaS Survey Infographic, which highlights major parts of the SaaS Survey results. With all the data in the survey to help SaaS companies benchmark their growth, we thought it would be useful to show the major insights in a more graphical form.
As this is the 4th annual SaaS survey in partnership with Pacific Crest Securities we’re able to share this year’s results and look at how key metrics have changed over time. Thanks again to my partners in this effort David Spitz and his team at Pacific Crest Securities (@dspitz and @PacCrestSec, respectively on Twitter). Thank you too, to the forEntrepreneurs readers who took the time to complete the survey! I look forward to hearing your comments below.
Operational Aspects
How is Your SaaS Application Delivered?
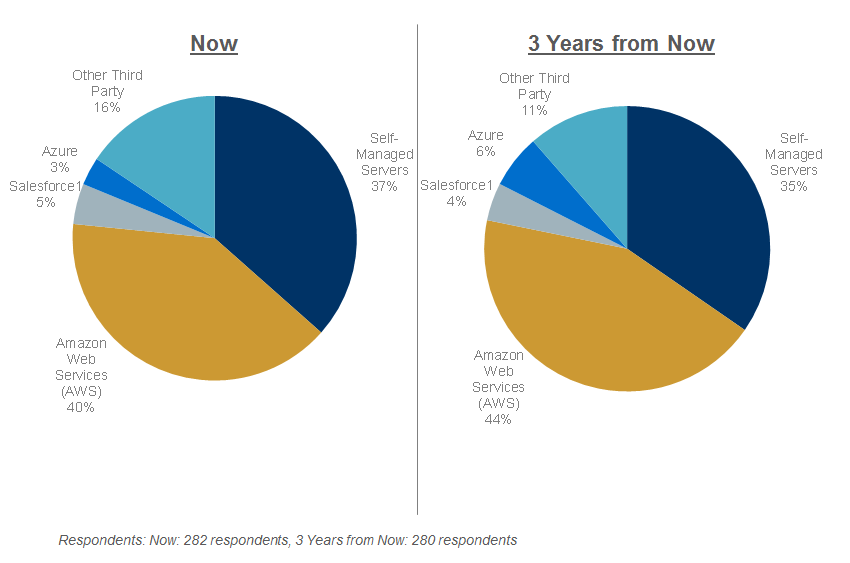
We asked participants to provide information on their primary application delivery method (in-house or third-party) and how they expect that to change over the next three years. Over 60% already use 3rd parties predominantly (two-thirds of which is AWS); expectations for the future show little change. Compared with previous surveys, the trend toward using 3rd party public cloud is huge – self-managed is down from 52% last year to 37% this year! This makes sense, as you’ll see below–those in the cloud are generally growing faster and it is no longer more expensive to use a 3rd-party.
SaaS Application Delivery Method(1) as a Function of Size of Company
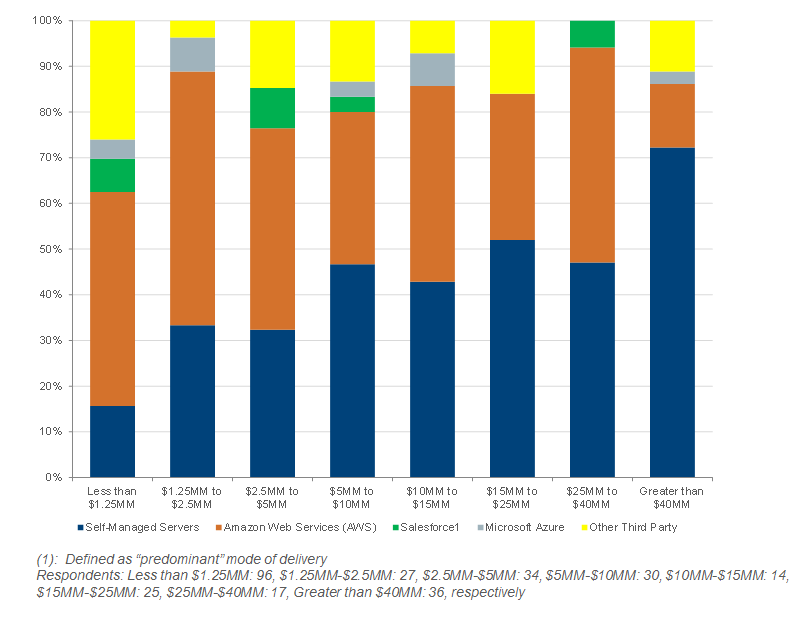
Compared with previous results, we see a shift away from self-managed at every level. When filtered by company size, smaller respondents reported more frequent use of third-party providers as their primary application delivery method, while the largest companies were more likely to use self-managed servers.
Comparison of Growth Rates for Companies Managing Their Own Servers vs. Using 3rd Parties

What Are Your Operational Costs to Deliver the SaaS Application?
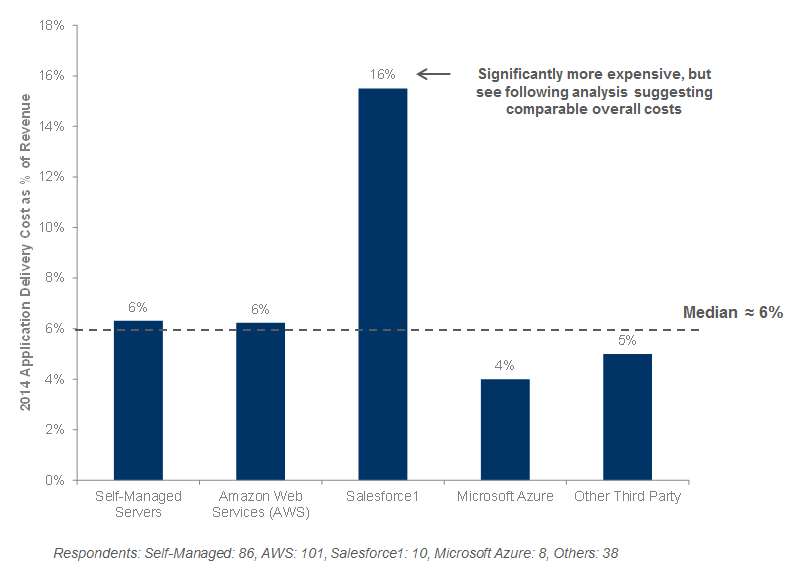
It is not cheaper to self-host vs hosting through AWS, and hosting through Azure is even cheaper. Respondents relying primarily on self-managed servers reported a median delivery cost of 6% of sales, comparable to those primarily using AWS. The median cost of delivery for respondents on Salesforce1 was considerably higher at 16%. These results are largely consistent with 2014 results.
Operational Costs as a Function of SaaS Application Delivery, Grouped by Size Tiers
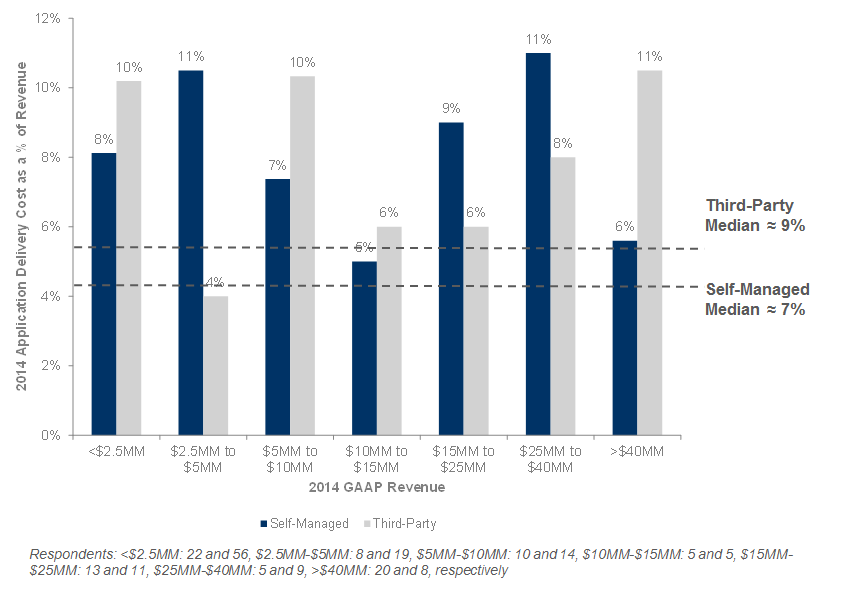
Somewhat surprisingly, among respondents, a company’s size has little impact on delivery costs as a percentage of revenues. As we saw above, the greater “median” cost of third-party hosted servers was driven up by the use of Salesforce.
Subscription Gross Margin as a Function of SaaS Application Delivery Method
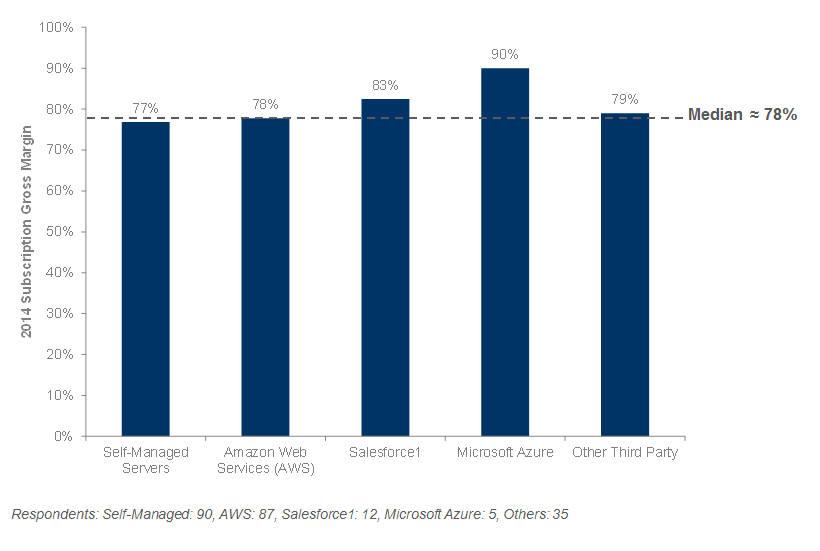
Interestingly, despite the aforementioned differences in estimated operational costs, median subscription gross margins were much more closely aligned when filtered by SaaS application delivery method. (Azure aberration is likely due to sparse data).
Cost Structure
Cost Structure and Future Expected Operating Leverage (Excluding Companies <$2.5MM in Revenue)
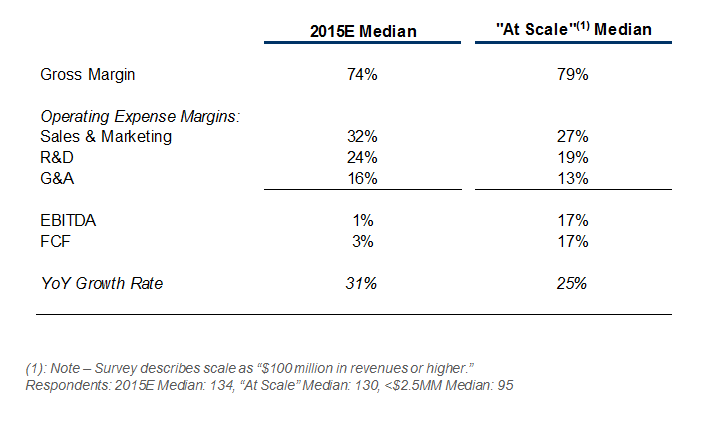
The median numbers reflect respondents’ beliefs that the most operating leverage will come from improvements in gross margin, S&M and R&D. This year’s results are very similar results to last year’s survey. EBITDA at scale appears to be very ambitious, and is higher than what we typically see in high growth companies where they are not trying to be profitable too early, and instead are investing in growth. Even the public companies, shown in the chart below, are not delivering those EBITDA margins.
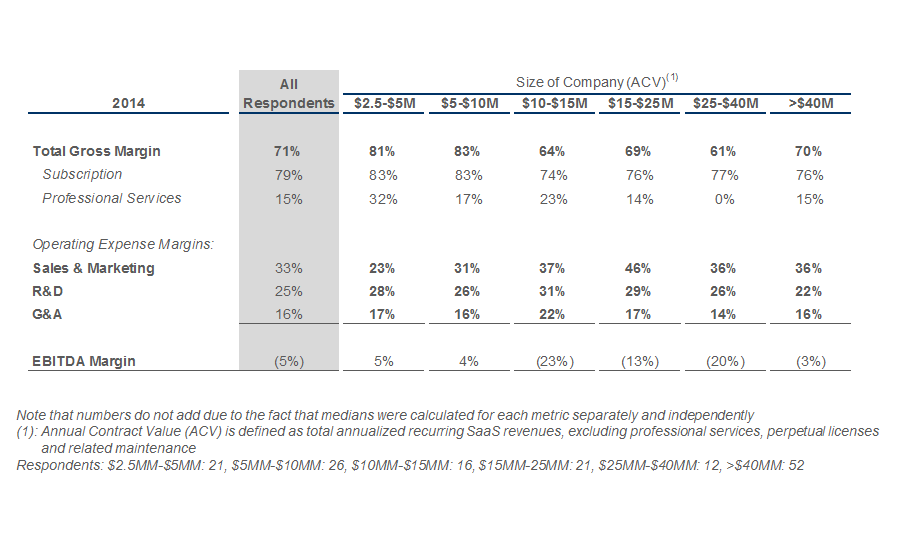
Median Cost Structure by Size (Includes Only Companies with >$2.5MM in ACV)
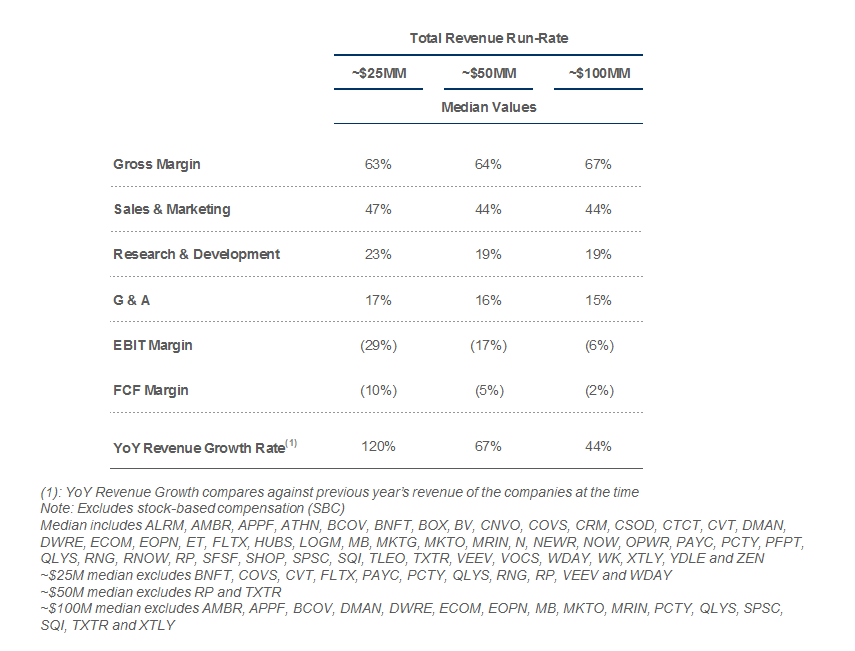
For Comparison: Historical Results of Selected Public SaaS Companies
Sales & Marketing Spend vs. Growth Rate (Excluding Companies <$2.5MM in Revenue)
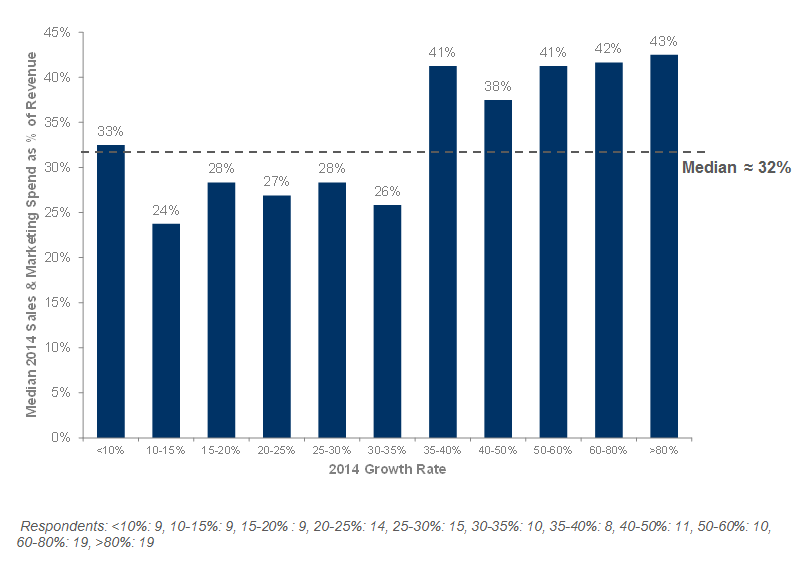
Not surprisingly, companies which spend more on sales & marketing (as a % of revenue) grew at a faster rate than those which spend less. It is interesting to see a step function at 35% growth, and not much increase in sales & marketing spend required for higher growth rates.These are very similar results to last year’s survey.
As I’ve advised in previous posts, companies who have a good LTV (lifetime value) to CAC ratio and can recover their CAC in a reasonable time when compared to the capital they have available, should aggressively go after sales and marketing. With this type of ratio, more spend should result in more customers and a good return, as long as you don’t increase CAC or reduce LTV as you increase spend.
Contracting & Pricing
Median Annual Contract Size (ACV) per Customer
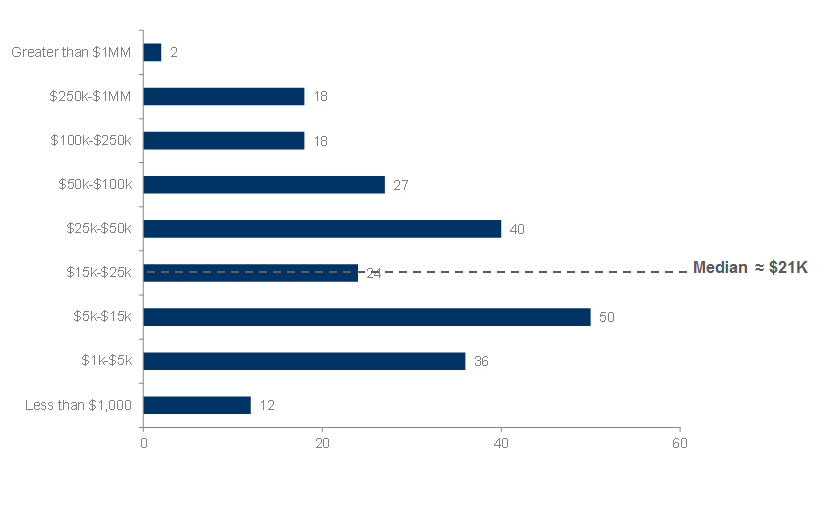
The median initial annual contract size (subscription component only) for the group was $21K per year. These results are in-line with previous survey medians of $21K, $20K and $24K in 2014, 2013 and 2012, respectively.
Median / Typical Contract Terms for the Group
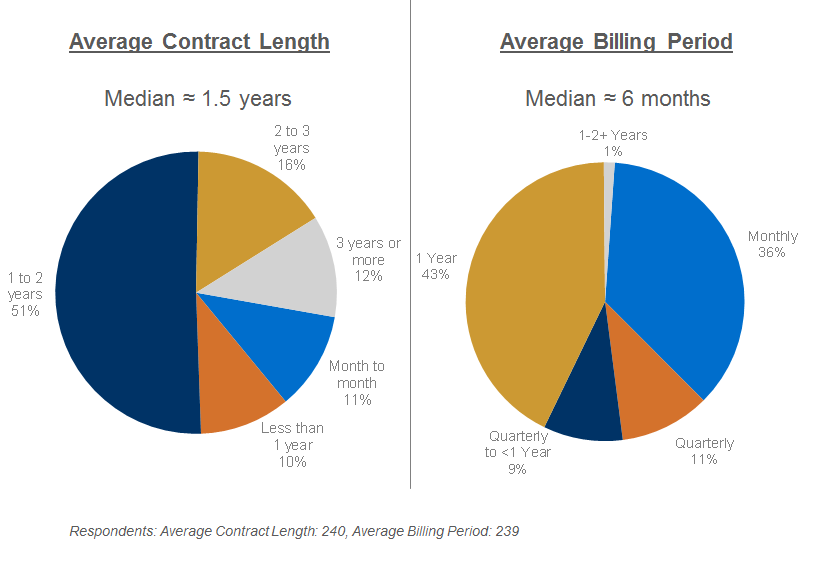
The median average contract length is 1.5 years; and the median billing term is six months in advance. This is essentially the same median contract length as in the 2014 survey, while the group has shown slightly more aggressive (longer forward) billing (median of 6 months vs. 3 months last year).
Contract Length as a Function of Contract Size
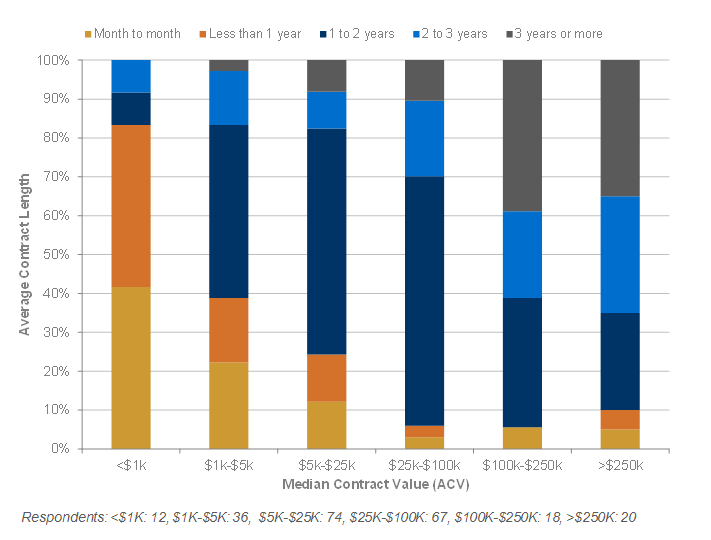
The phenomenon of longer contract terms for larger contracts is pretty clear. Companies in the “elephant hunter” group are booking longer term contracts. 60% of contracts larger than $100K are more than one year in duration. And, respondents with >$250K ACV book 35% of their contracts at 3 years or longer (compared to only 5% in the 2014 group).
What is Your Primary Pricing Metric?
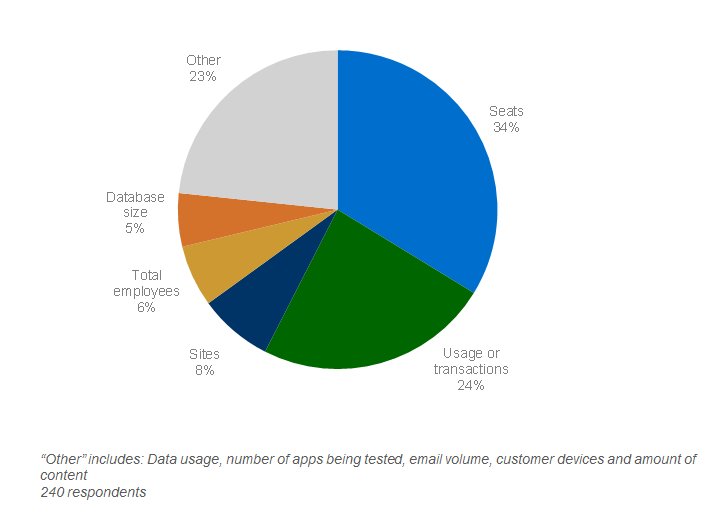
These results are largely in-line with 2014, 2013 and 2012 results.
Annual Gross Dollar Churn (Excluding Companies <$2.5MM in Revenue)
“What percentage of total ACV on a dollar basis churns in a given year?”(1)
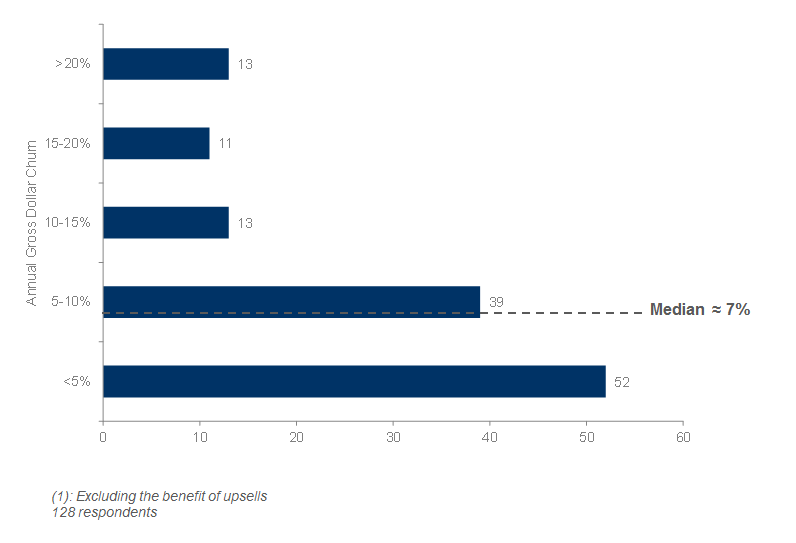
Median annual gross dollar churn (without the benefit of upsells) is 7%. The results were virtually the same when including companies <$2.5MM in revenues. This result is in the same range as earlier results (6% in 2014, 8% in 2013, 5% in 2012).
Annual Unit Churn(1) (Excluding Companies <$2.5MM in Revenue)
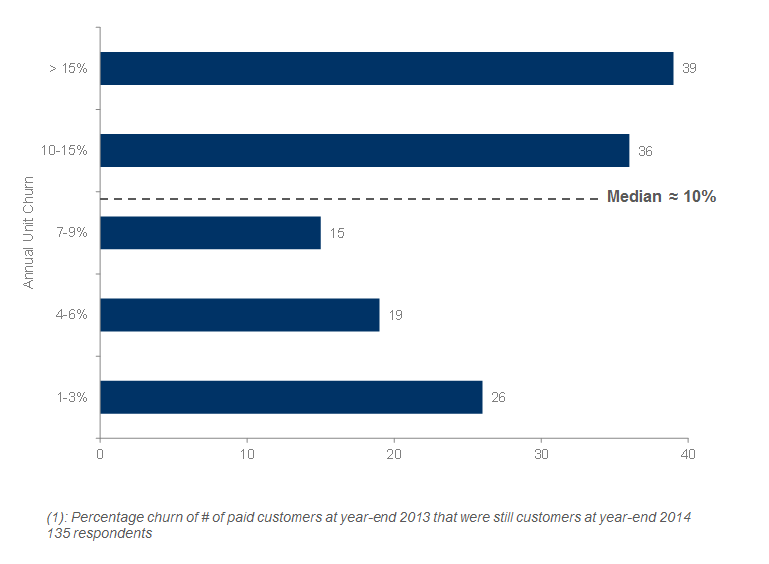
Reported median annual unit churn (by customer count) is 10% for the group. This result is slightly higher than the 2014 and 2013 results of 8%.
Annual Gross Dollar Churn as a Function of Contract Length (Excluding Companies <$2.5MM in Revenue)
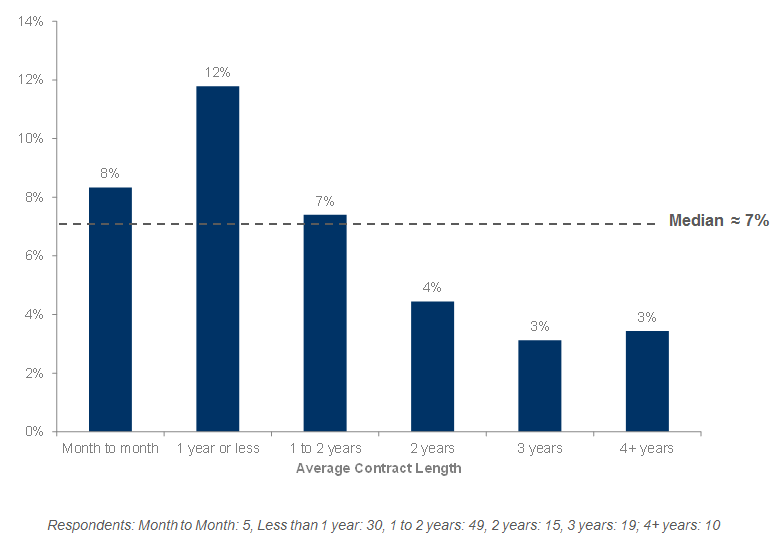
Not surprisingly, companies with very long term contracts (2+ years) have the lowest annual dollar churn. As expected, companies with short-term contracts (<1 year) tend to experience higher churn. Results are consistent with those from last year; the exception being companies using month to month contracts, which show significantly lower churn rates in this year’s survey (8% vs. 13% in the 2014 survey).
Annual Gross Dollar Churn as a Function of Contract Size (Excluding Companies <$2.5MM in Revenue)
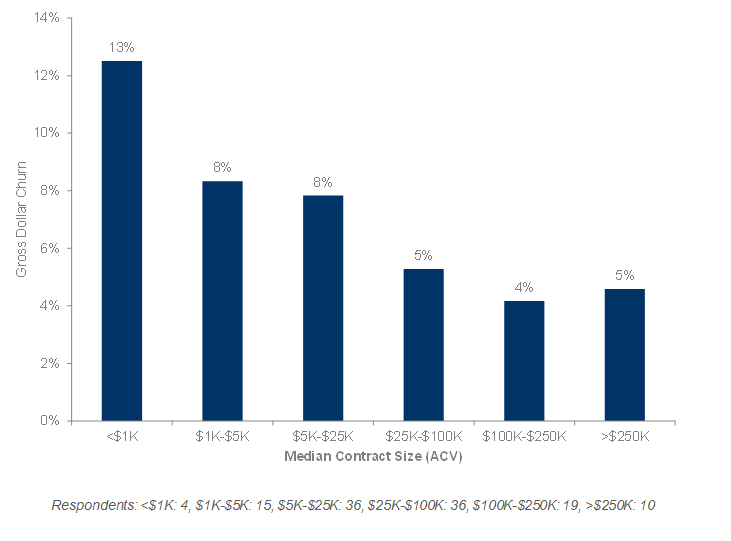
As contract sizes increase, gross dollar churn generally trended downwards (mostly related to longer term contracts, presumably). These results are very similar to previous results.
Annual Gross Dollar Churn as a Function of Primary Distribution Mode (Excluding Companies <$2.5MM in Revenue)
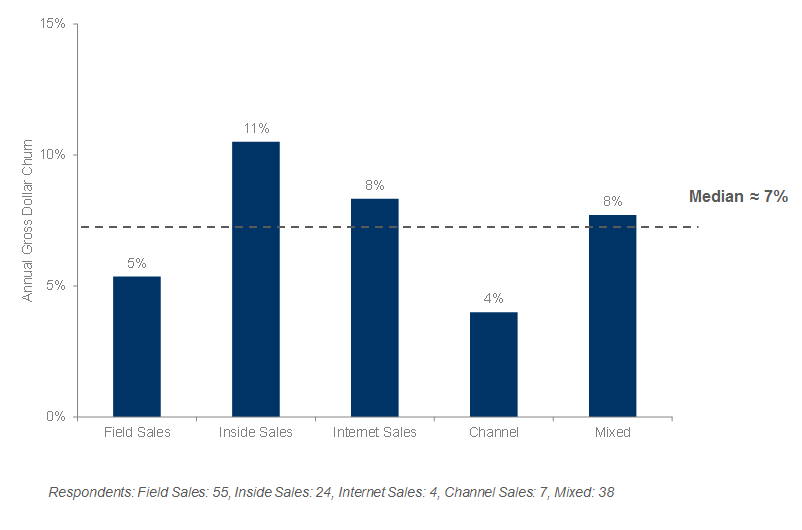
Those companies employing primarily field sales had lower churn rates than those employing primarily inside sales or mixed distribution. This is largely consistent with previous survey results.
Annual Net Dollar Retention from Existing Customers
“How much do you expect your ACV from existing customers to change, including the effect of both churn and upsells?”(1)
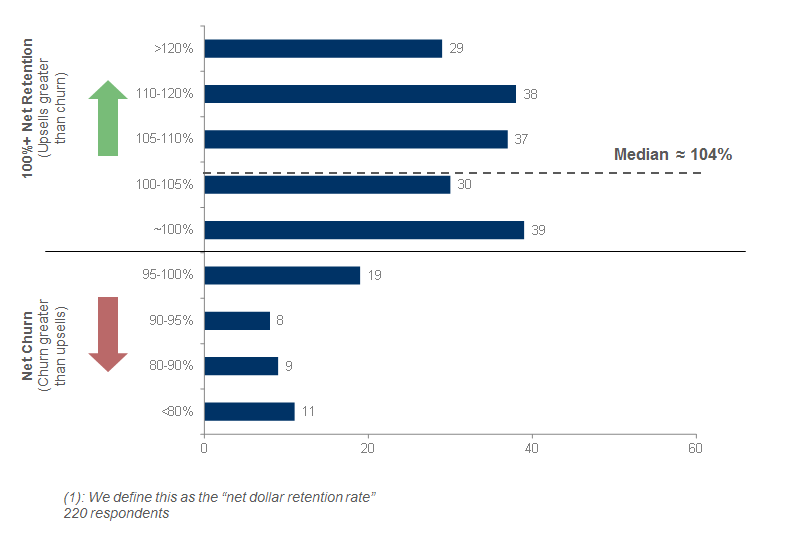
The median annual net dollar retention rates, including churn, but also including the benefit of upsells, is 104%. The result does not change materially when removing the smallest companies (<$2.5MM in revenue) from the group (likely due to longer contracting). This year’s results are nominally higher than 2014 (103%) and 2013 (101%) and 2 percentage points lower than 2012 (106%).
Comparison of Unit Economic Leaders to All Other Companies (Excluding Companies <$5MM in Revenue)
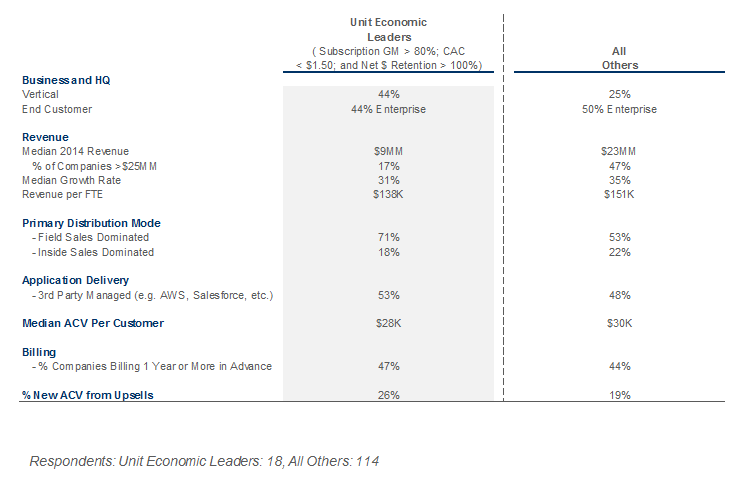
Superior unit economics – high lifetime value of customer (LTV) and low CAC – are critical success factors. We compared companies with the strongest metrics used to derive LTV and CAC with everyone else, and found some interesting patterns. Among the Unit Economic Leaders we see: smaller companies, more field dominated selling, more vertical market SaaS companies; smaller component Enterprise end customers; and higher component of upsells.
Capital Requirements
Capital Raised So Far
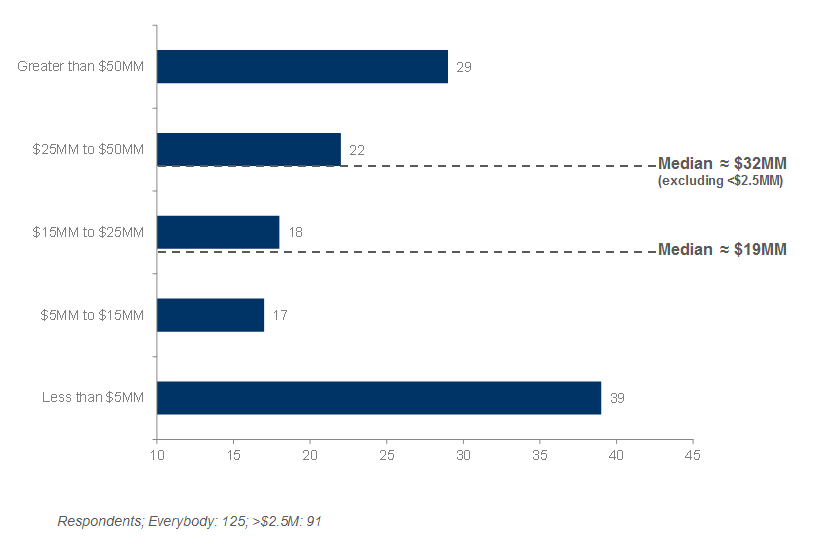
Companies in the survey group have raised a median of roughly $19MM in primary equity capital so far (excluding secondary stock sales). If we exclude companies <$2.5MM, the median jumps up to $32MM. This year’s results are well above the 2014 and 2013 results of $8MM in raised capital. However, these results are similar to the $23MM in capital raised by participants in the 2012 and survey.
Analysis of Companies by Capital Raised
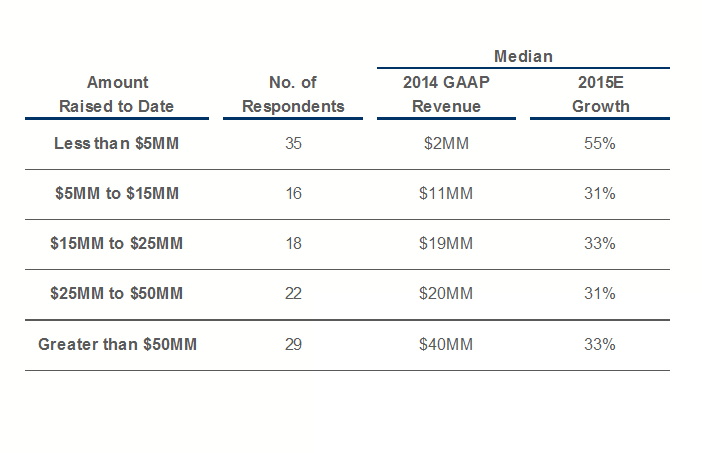
The 2015 respondents have much greater revenue traction per dollars raised than previous years’ groups. However, the relatively low growth rates for companies raising over $50MM, is surprising. Low growth rates seen across all groups are likely pulled down by the law of averages.
Capital Efficiency Expectations – Median Levels for the Group
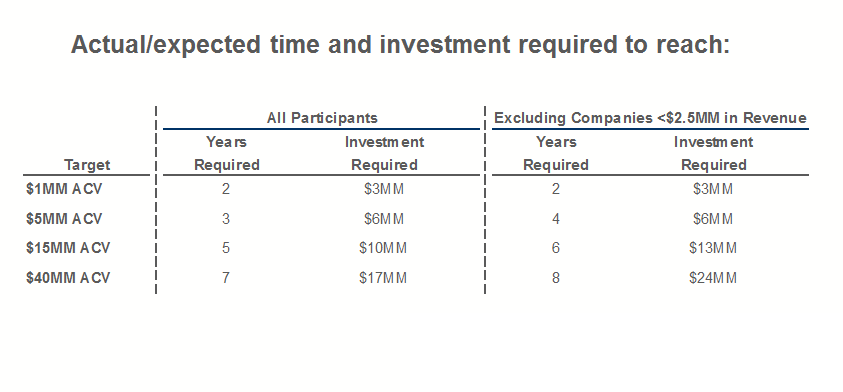
This year’s results were very similar to 2014 and 2013 survey results.
Accounting Policies
Subscription Revenue Recognition Policies
“When do you typically begin recognizing subscription revenues on a new contract with a new customer?”
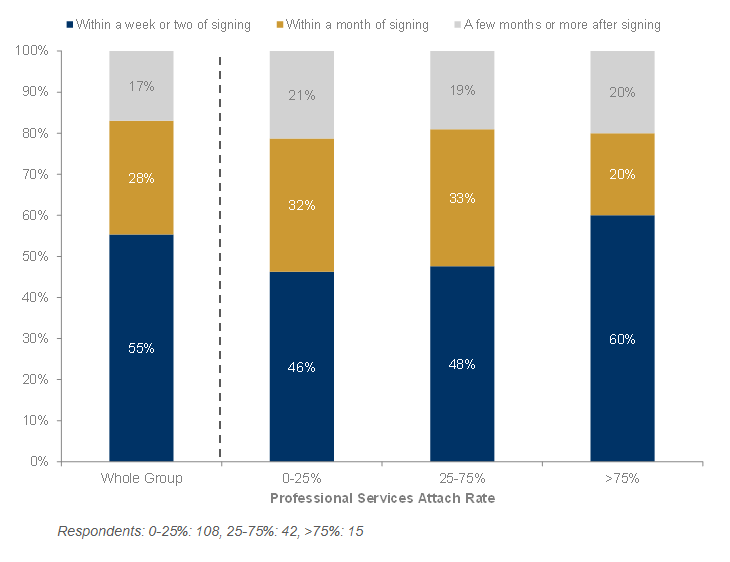
Approximately 55% of the respondents indicated that they begin recognition very soon (within a week or two) after signing new contracts. It’s interesting to see that many companies with significant services were still able to start subscription revenue recognition quickly. These results are largely unchanged from previous years’ results.
Professional Services Revenue Recognition Policies
“What is the predominant mode for recognizing professional services revenues?”

The clear majority of respondents offering professional services indicated that they recognize that revenue as the services are provided.
Sales Commission Costs Recognition Policies
“How do you recognize sales commission costs (deferred or recognized upfront)?”
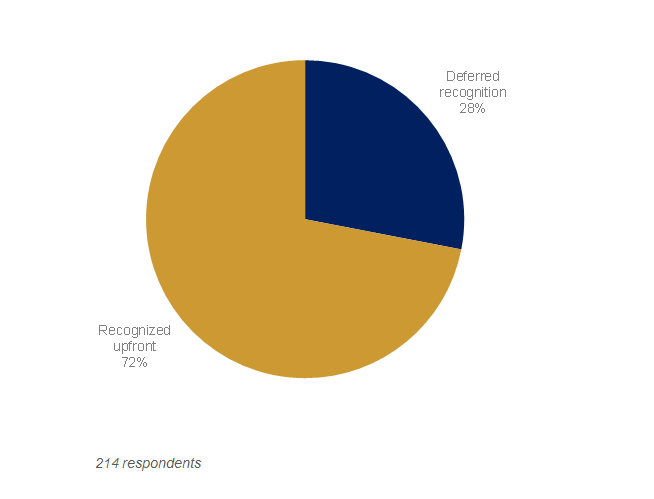
We also inquired as to the recognition of sales commission costs. We found two-thirds of respondents indicating that they recognize commission costs up-front. There is a 5% increase in “recognized upfront” from last year’s 67%. The issue with recognizing commission up front is that if you have a very strong quarter, you will be hit with big expenses well before you see the benefit of those revenues. However, this approach does simplify what could be significant accounting complexity that comes into play when tracking deferred recognition of commissions.
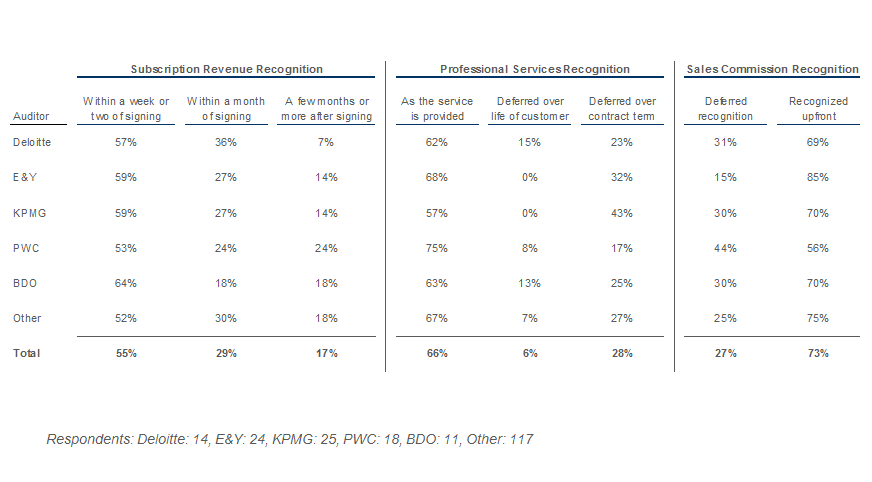
Accounting Policies Across Selected Accounting Firms
I hope you found these posts helpful. We’d love to hear your comments below about this year’s survey findings and what data you’d find useful to see next year.
To get results about growth trends and go-to-markets, please read Part 1 of the SaaS Survey. To see a visual summary of the results, see the forEntrepreneurs SaaS Survey Infographic.


