
A short study of this web site reveals that a hugely important factor for success in startup companies is finding ways to acquire customers at a low cost. In the Business Models section, we looked at the perfect business model: Viral customer acquisition with good monetization. However viral growth turns out to be an elusive goal, and only a very small number of companies actually achieve true viral growth.
In 2005, I invested in a company called Tabblo (acquired by HP in 2007), and had the good fortune to work with an outstanding entrepreneur, Antonio Rodriguez. Tabblo did manage to achieve good viral growth, but around the same time YouTube was launched and managed to achieve explosive viral growth. In the process of looking at these two companies, we learnt several important things about virality. This post digs deeper into what it takes to achieve viral growth, and examines the key variables that drive viral growth.
To give you a preview of this post, what you will learn is that there are two key parameters that drive how viral growth happens, the Viral Coefficient, and the Viral Cycle Time. To fully illustrate the arguments, I have included two spreadsheet models (embedded) that you can play with interactively to see how viral growth works. There is a risk with this level of depth, that some readers will find this too technical, and if you find yourself reacting that way, may I recommend that you jump straight to the conclusion, which is under the heading Lessons Learned towards the bottom of the article.
What we want to understand in these two models, is how the population of Customers changes over time. The first model that we will build looks in a very simple way at how viral growth works in the marketing world.
The Viral Coefficient (K)
Imagine you are starting a new company that plans to acquire customers through viral growth. You have several friends that you use to become your first customers, and they in turn start inviting friends to join, and those friends start inviting friends, etc.
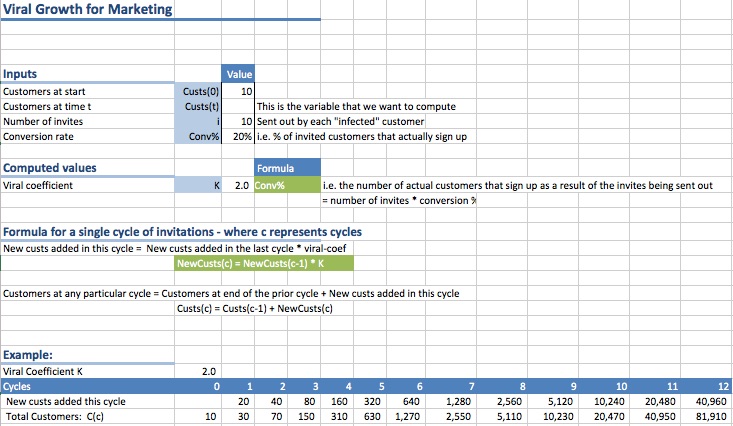
The model at this stage has the following inputs:
| Variable Name | Description | Example Value |
| Custs(0) | Initial set of Customers | 10 |
| i | No of invites sent out be each new customer | 10 |
| conv% | The percentage of invites that convert into customers | 20% |
The first thing that we need to calculate is the number of new customers that each existing customer is able to successfully convert. This turns out to be an extremely important variable, and is known as the Viral Coefficient. The formula to calculate the viral coefficient is pretty simple: multiply the number of invitations by the conversion rate.
| K | Viral Coefficient | K = i * conv% |
Now lets take a look at how K affects customer growth as we go through the first cycle of viral “infection”. Our initial 10 customers will each send out 10 invitations, and successfully convert 20% of those (i.e. 2 new customers each). So the total customers after the first cycle will be equal to the starting 10, plus the new 20, which equals 30.
(In case the model above does not appear, click here to download the spreadsheet.)
To fully understand the model, it’s useful to look at the second, and subsequent, cycles of growth. In the model above, only the new customers that were added in the prior cycle send out invitations. This is because it is highly unlikely that the entire population will continue to send out invitations every cycle. Every time I have looked at other blog articles or formula for Viral Growth, they appear to have gotten this part of the calculation wrong.
Understanding the impact of the Viral Coefficient
Now that we have the model built, we can play with the variables to see what effect they have. In the spreadsheet above, go to cell B11, and change the Conversion rate for invites (conv%) to 5%. This will make the Viral Coefficient less than 1. Now look at what that did to your population growth. Instead of continuing to grow, it grows to 20 people, and then stops.
What this tell us is very interesting:
The Viral Coefficient must be greater than 1 to have viral growth.
Further playing with the spreadsheet will show that increasing the viral coefficient by increasing the number of invites sent out, or the conversion rate, has a nice impact on how the population grows. Try this out by changing cells B10 and B11 in the model above. Later on we will talk about how to design your application to maximize these values.
The Second Important Variable: Viral Cycle Time
Antonio Rodriguez built Tabblo around the same time that YouTube was built. Both sites were viral, but while Tabblo was reasonably successful, YouTube exploded and amassed users at a rate that had not been seen before on the Internet. What was going on here?
To answer this question, we have to look at the Viral Cycle Time,(which we will refer to in formulas as “ct”).
The full viral cycle involves several steps that work in a loop:

The Viral Cycle Time is the time that it takes for this cycle to complete.
In YouTube’s case the Viral Cycle Time was extremely short: a user would come to the site, see a funny video, and immediately send the link on to their friends. Tabblo, on the other hand, had a much longer cycle time. A customer would post some photos on the site and invite their friends. The friends might see the photos on Tabblo, and like the experience and decide that they would use the site the next time they took photos they wanted to share. However, that is where the problem came in: it could take months before they next took photos, and decided to share them.
Later on this post, we will talk about how to optimize Viral Cycle Time – (see Lessons Learnt).
How Viral Cycle Time affects growth
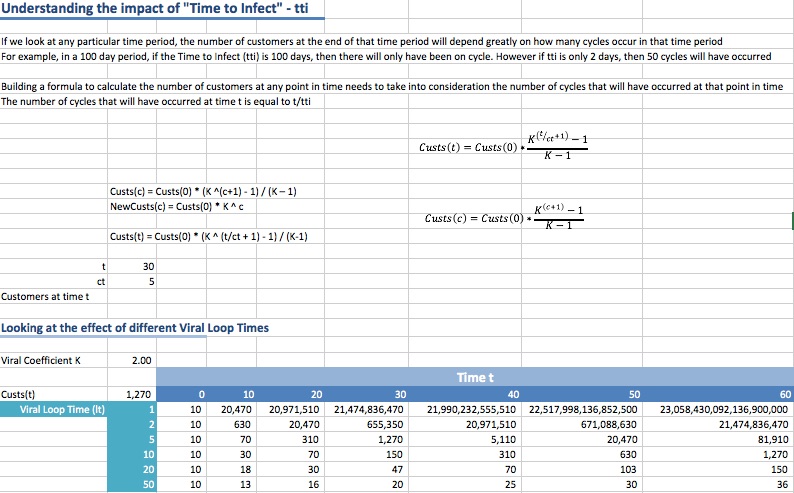
To model Viral Cycle Time’s effect on growth, I searched the web, high and low, looking for a pre-defined formula. To my great surprise, there was no formula that I could find that correctly calculated customer growth, and showed the impact of Viral Cycle Time. What was also surprising, was that I did find several blogs showing formulae for viral growth, but in every case, they appeared to make the same mistake, which was assuming that the entire customer base would continue sending out invitations for every cycle. So I collaborated with my partner, Stan Reiss, who turns out to be a whole lot smarter than I am, and he helped me develop the fomulae that are used in the more sophisticated model for viral growth below:
(In case the model above does not appear, click here to download the spreadsheet.)
A quick look at the table that shows the effect of varying the Viral Cycle Time shows that customer growth is dramatically affected by a shorter cycle time. For example, after 20 days with a cycle time of two days, you will have 20,470 users, but if you halved that cycle time to one day, you would have over 20 million users! It is logical that it would be better to have more cycles occur, but it is less obvious just how much better. A quick look at the formula tells the whole story. The Viral Coefficient K is raised to the power of t/ct, so reducing ct has a far more powerful effect than increasing K.
This explains why YouTube exploded at a faster rate than ever seen before.
Lessons Learned
There are a large number of interesting lessons to learn from the above models:
- Unless you have a Viral Coefficient that is greater than 1, you will not have true viral growth.
- The most important factor to increasing growth is not the Viral Coefficient, but the Viral Cycle Time (ct) which should be made as short as possible. This will have a dramatic effect on growth.
- The second most important area to focus is the Viral Coefficient (K). Anything that you can do to increase the number of invitations sent out, and the conversion rate, will have a significant effect on growth.
In addition to the above lessons that come from the model, there are some other important observations:
- Virality is not a marketing strategy that can be executed by the marketing department. It has to be built into your product right from the beginning. This is a function that needs to be thought through by the product designers and developed by the engineers.
- The most viral products are those that only work if they are shared. For example, Skype only worked in the early days if you got your friends on to Skype, otherwise you had no way to call them. If you have an application today, think about how you can make it social, where it would work better by sharing data with friends/co-workers. That provides a great incentive for customers to invite their friends/colleagues to use the application.
- To make the Viral Cycle Time as short as possible, we can apply the same thought process that we use in Building a Sales and Marketing Machine, where we look at what are the customers motivations and negative reactions as they flow through the viral cycle. For example, when I reach the stage where I have to enter my friends addresses, I will not bother to do very many if I have to look them up in another program, and copy and paste them one-by-one into the browser. You can solve this problem by providing me with Facebook Connect integration to invite my Facebook friends, and an adapter to import my email contacts. (Check out the “Share This” button on the left side of this post as an example of how this can be done.) Getting at email contacts is easy with web mail clients like GMail, etc. – but harder with Outlook. However viral products like LinkedIn have created Outlook adapters that you can download. It is also feasible to get at that information via Outlook Web Access (OWA) provided you can deal with the security concerns.You should also be looking for ways to encourage customers to invite people at various junctures in their use of the application. And of course, you should be asking yourself the question: is the value proposition of your product really that compelling that your customers will want to share it with others? Another great way to increase virality is to incent customers with a reward for every customer they successfully convert. Since this can result in an individual feeling guilty that they are making money off their friends, the best way to do this is to also provide the friend that is receiving the invitation with an equal incentive. Now your customer will feel like they are doing their friends a favor.
- Consider leveraging viral platforms such as Facebook, which have built in social features to let friends know what apps you are using. The wall, and status updates provide a great way for their friends see your app.
- Use A/B testing to figure out which approaches and creative presentations are getting you the highest conversion rates.
- If you are successful in creating a viral model with very short cycle times, watch out for what can happen. Several companies that have been lucky enough to achieve this have been shocked by the enormous need to scale server capacity. Fortunately with cloud computing offerings such as Amazon EC2 and S3, it is easier than in the past to scale on demand.
Hybrid Viral Models
Many entrepreneurs reading this post will realize that they may not have the means to achieve true viral growth (where they have a Viral Coefficient of greater than 1). Rather than giving up, it is worth considering a hybrid viral model. In the hybrid viral model, you make up for the shortfall in customers by acquiring those through some other means such as paid search, or SEO.
Model Limitations
The model above is pretty simplistic and does not take into consideration several real world phenomena:
- What happens when you grow so fast that you start to saturate the population. This has happened to several Facebook app developers. They experience very rapid growth, and then suddenly the growth dies. Andrew Chen has written a great blog post about this: Facebook viral marketing: When and why do apps “jump the shark?”. (Side note: I don’t believe that the equation that Andrew puts forward for simple viral growth is correct, as it assumes that the entire population will continue sending out invitations at each viral cycle. However his work on saturation of the population is very relevant for highly successful viral apps.) In case you are interested in where the term “jump the shark” came from check this out: Wikipedia: Jumping the shark.
- What happens if you have attrition in your customer base over time. An easy way to extend the model to take this into consideration would be to add a variable to model Attrition Rate as a percentage of the entire installed base at each cycle, and simply subract this from the total population at each cycle. This topic is nicely covered in this blog post by Andrew Chen: Is your website a leaky bucket? 4 scenarios for user retention.
- The customers that you have may send out more than one set of invitations beyond the initial set.
- etc.
Further Resources
Since publishing this post, I created a SlideShare presentation that has a several additional ideas on viral marketing: The Science behind Viral Marketing. Also check out Andrew Chen’s blog, as he has written extensively on the subject of Viral Growth. For example, here is one great example: What’s your viral loop? Understanding the engine of adoption.
Uzi Shmilovici has a nice list here of the Eight Ways To Go Viral.
Kevin Lawler very kindly created a post explaining how to derive the formula for viral growth used in this post: Virality Formula.
Acknowledgements and Thanks
My thanks to Antonio Rodriguez, the founder of Tabblo, who got me started on thinking about this topic several years ago. Also to Andrew Chen, whose writings on this topic are excellent. And to my partner Stan Reiss, who took my simple logic and turned it into an elegant mathematical formula.


